Inside this Article
Key Takeaways:
- Global scope: Over 49.6 million people (0.61% of the global population) are subjected to modern slavery, surpassing the populations of around 200 countries.
- Most common forms of modern slavery:
- Forced labor: Includes state-imposed and privately-imposed forced labor, as well as commercial sexual exploitation.
- Forced marriage: Involves at least one non-consenting partner and accounts for 44% of modern slavery cases.
- Demographics:
- Gender: Women represent 54% of victims; men represent 46%.
- Age: 75% are adults; 25% are children.
- Geographical distribution:
- Income levels: 15% of victims are in high-income countries, 72% in middle-income countries, and 13% in low-income nations.
- Trends:
- Increase: Modern slavery increased by nearly 25% between 2016 and 2021.
- Forced marriage growth: Up by more than 40% in the same period.
- Economic sectors: Forced labor is prevalent in non-domestic services, manufacturing, and construction. Sectors with high demand for unskilled labor are hotspots.
- Key recommendations:
- Raise awareness: Increase public understanding and vigilance.
- Supply chain scrutiny: Hold companies accountable for forced labor in their supply chains.
- Address wealth inequality: Implement policies to support low-income households.
- Community engagement: Customize interventions based on community needs.
How We’ll Present the Data and Findings
We will present and analyze the data in 4 chapters:- Global Estimates: An overview of modern slavery data, covering all forms of slavery.
- Forced Labor: A form of modern slavery that includes state-imposed forced labor, privately-imposed forced labor, and forced commercial sexual exploitation.
- Forced Marriage: Unions that involve at least one non-consenting partner.
- The Global Slavery Index (GSI): A ranking of world nations based on the prevalence of modern slavery within their borders and also their vulnerability and response to said issue.
Please note that, throughout this article, ratios are presented in two different formats depending on the type of information we are trying to convey:
– Percentage (%): This tells us the proportion of total modern slavery cases that correspond to a specific category of analysis. For example, of the 49.6 million people affected by modern slavery worldwide, 22.84 million are men, and 26.73 million are women. This means men represent 46% of modern slavery victims, while women represent the remaining 54%.
– Permille (‰): We use this to represent prevalence rates, which give us perspective on how pervasive modern slavery is on a given population (beyond the modern slavery framework). Following the example above, there are over 4 billion men worldwide, and 22.84 million of them are directly affected by modern slavery; this means that 5.8 per every 1,000 men in the world are modern slavery victims (5.8‰).
Following the same logic, 26.73 million out of ~3.9 billion women in the world are directly affected by modern slavery, giving us a prevalence rate of 6.9‰. So, unlike percentages (which should always add up to 100%), the prevalence rates found in this article do not add up to any specific number, as each is calculated based on its own corresponding total population.
Global Estimates
The data suggests that 49.6 million people worldwide are affected by modern slavery, which equates to 6.3 victims for every 1,000 individuals.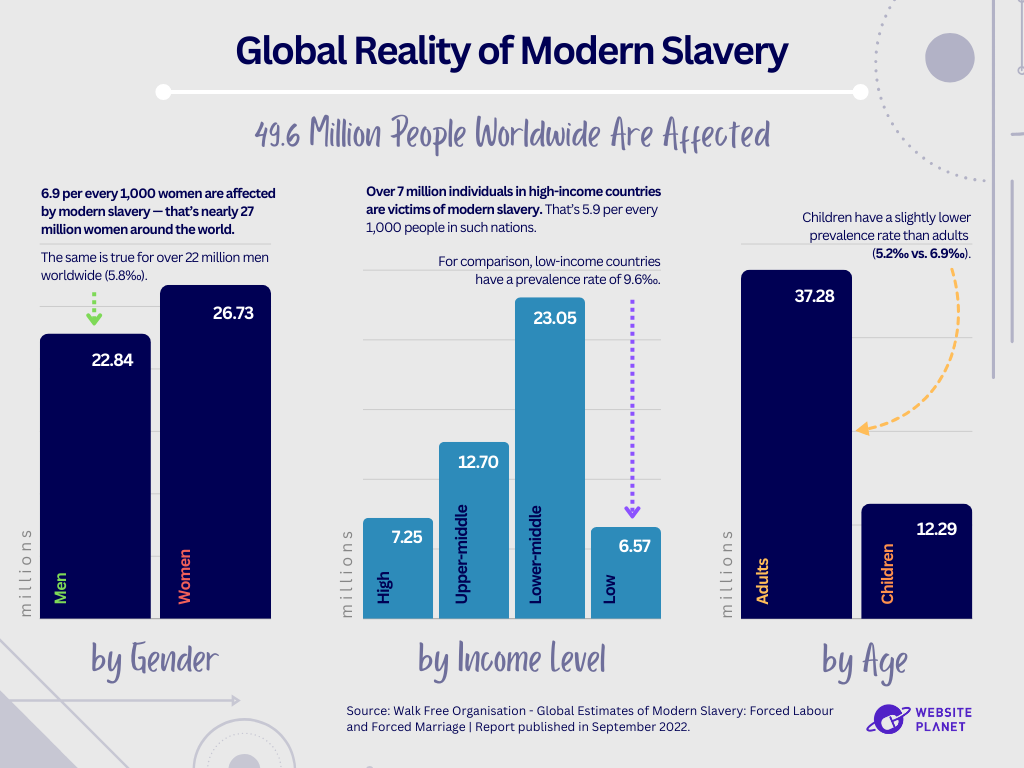 When analyzing the data, one of the first things that stands out is that adults constitute 75% of the victims, while a notable 25% are children. Furthermore, modern slavery affects more females than males in terms of population and prevalence rate (6.9‰ vs. 5.8‰).
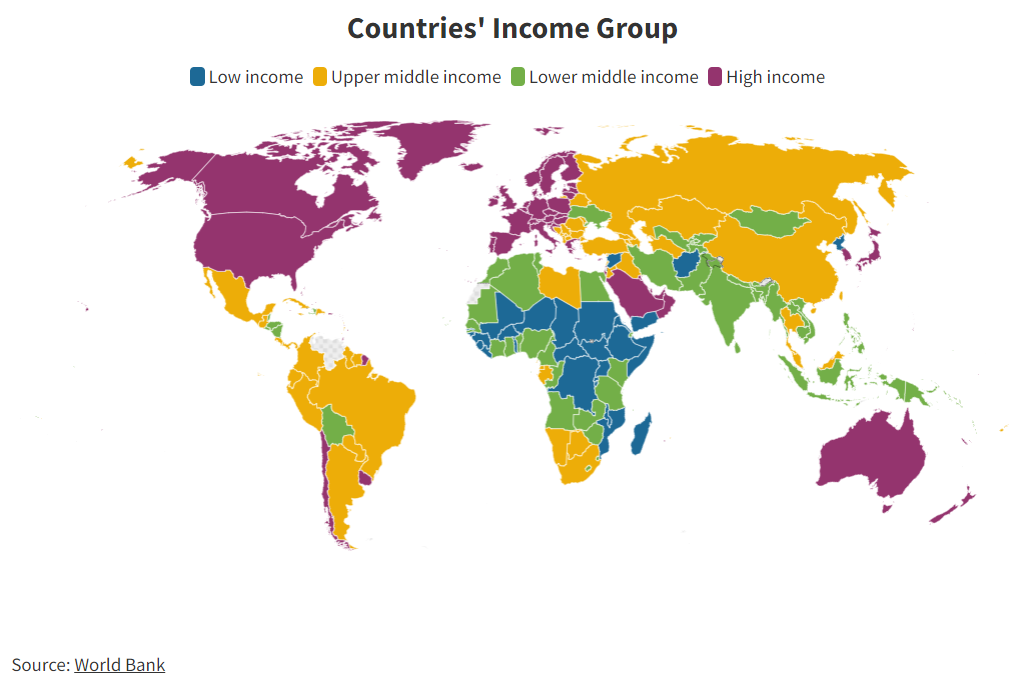
Slavery is often thought to be an issue for low-income countries, as lack of funding and political instability make governments ill-equipped to protect their vulnerable population effectively. Still, the numbers do not seem to support this hypothesis. Statistics suggest that 15% of victims are found in high-income nations, 72% in middle-income countries, and 13% in low-income nations.
So, although they have the highest share of the population in slavery (9.6‰), low-income countries have the fewest slaves. This is likely because wealthier countries have a demand for labor in low-paying positions, which their citizens are unlikely to fill. Vulnerable citizens from lower-income or conflict-ridden territories are trafficked to meet this labor shortage, resulting in a higher number of slaves in wealthier countries.
When analyzing the data, one of the first things that stands out is that adults constitute 75% of the victims, while a notable 25% are children. Furthermore, modern slavery affects more females than males in terms of population and prevalence rate (6.9‰ vs. 5.8‰).
Slavery is often thought to be an issue for low-income countries, as lack of funding and political instability make governments ill-equipped to protect their vulnerable population effectively. Still, the numbers do not seem to support this hypothesis. Statistics suggest that 15% of victims are found in high-income nations, 72% in middle-income countries, and 13% in low-income nations.
So, although they have the highest share of the population in slavery (9.6‰), low-income countries have the fewest slaves. This is likely because wealthier countries have a demand for labor in low-paying positions, which their citizens are unlikely to fill. Vulnerable citizens from lower-income or conflict-ridden territories are trafficked to meet this labor shortage, resulting in a higher number of slaves in wealthier countries.
The Troubling Trajectory of Modern Slavery
Current trends show that modern slavery is a growing problem. Between 2016 and 2021, the total number of victims increased by almost 25%. Forced marriage saw the highest growth rate, increasing by more than 40% during this five-year period. This statistic highlights the urgency of addressing forced marriage on a global scale. The latest data suggests that this type of modern slavery affects the highest number of people, accounting for 44% of all recorded victims.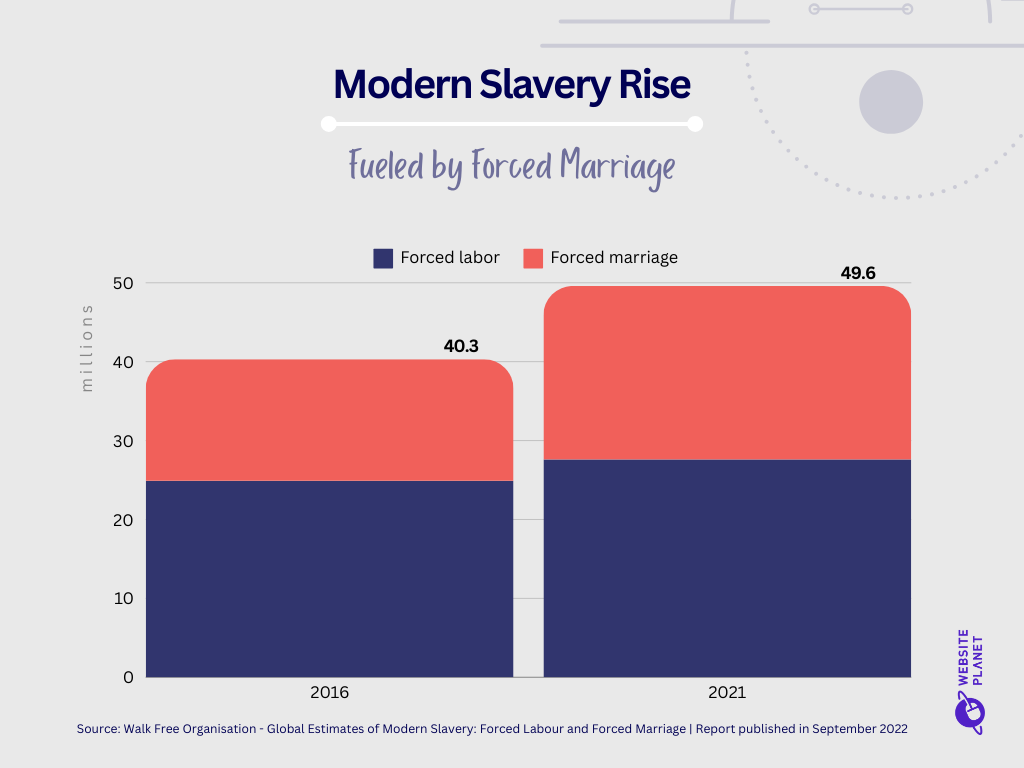 For comparison, forced labor saw a less dramatic (but still significant) increase of approximately 10% between 2016 and 2021.
The fact that privately imposed forced labor — that is, cases where a citizen or private organization exploits other individuals — far exceeds its state-imposed counterpart (35% vs. 8%) suggests that most cases are fueled by illicit profits, especially when considering that an additional 12% of cases fall into the forced commercial sexual exploitation category — instances where people are forced into sex work so that the slaver can make a profit.
For comparison, forced labor saw a less dramatic (but still significant) increase of approximately 10% between 2016 and 2021.
The fact that privately imposed forced labor — that is, cases where a citizen or private organization exploits other individuals — far exceeds its state-imposed counterpart (35% vs. 8%) suggests that most cases are fueled by illicit profits, especially when considering that an additional 12% of cases fall into the forced commercial sexual exploitation category — instances where people are forced into sex work so that the slaver can make a profit.
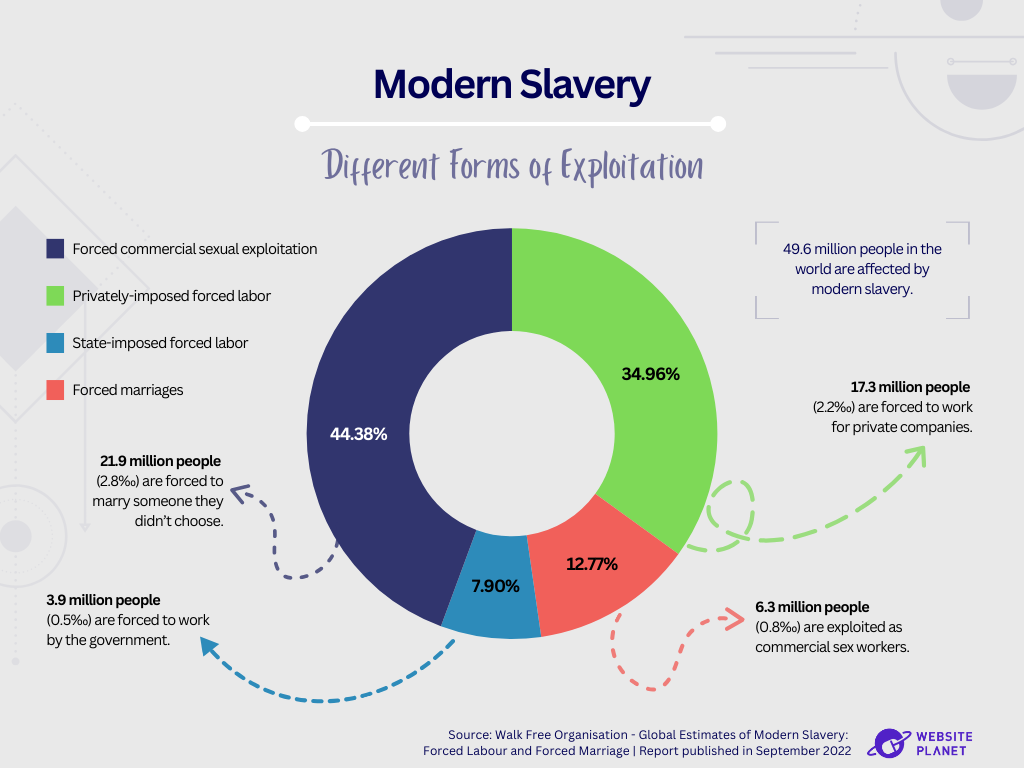 However, the largest share (44%) of modern slavery cases correspond to forced marriages. Although the practice may be viewed as traditional in some cultures, international organizations such as the United Nations have deemed it a violation of Human Rights, while others, such as the International Labour Organization, regard it as one of the most pervasive types of modern slavery.
Now, let us dive deeper into each one of these forms of human exploitation.
However, the largest share (44%) of modern slavery cases correspond to forced marriages. Although the practice may be viewed as traditional in some cultures, international organizations such as the United Nations have deemed it a violation of Human Rights, while others, such as the International Labour Organization, regard it as one of the most pervasive types of modern slavery.
Now, let us dive deeper into each one of these forms of human exploitation.
Forced Labor
Forced labor refers to those instances where people use force or intimidation tactics to coerce others into working against their will. For this research, this category includes state-imposed forced labor, privately-imposed forced labor, and forced commercial sexual exploitation.Privately-Imposed Forced Labor
Globally, non-state actors exploit 17.3 million people as forced laborers, and almost two-thirds of all those victims are male. This is likely because, apart from domestic work and forced sexual exploitation, most of the economic sectors using forced labor involve hard manual work. It is probably also why forced labor is adult-dominated (only 8% of the victims are children).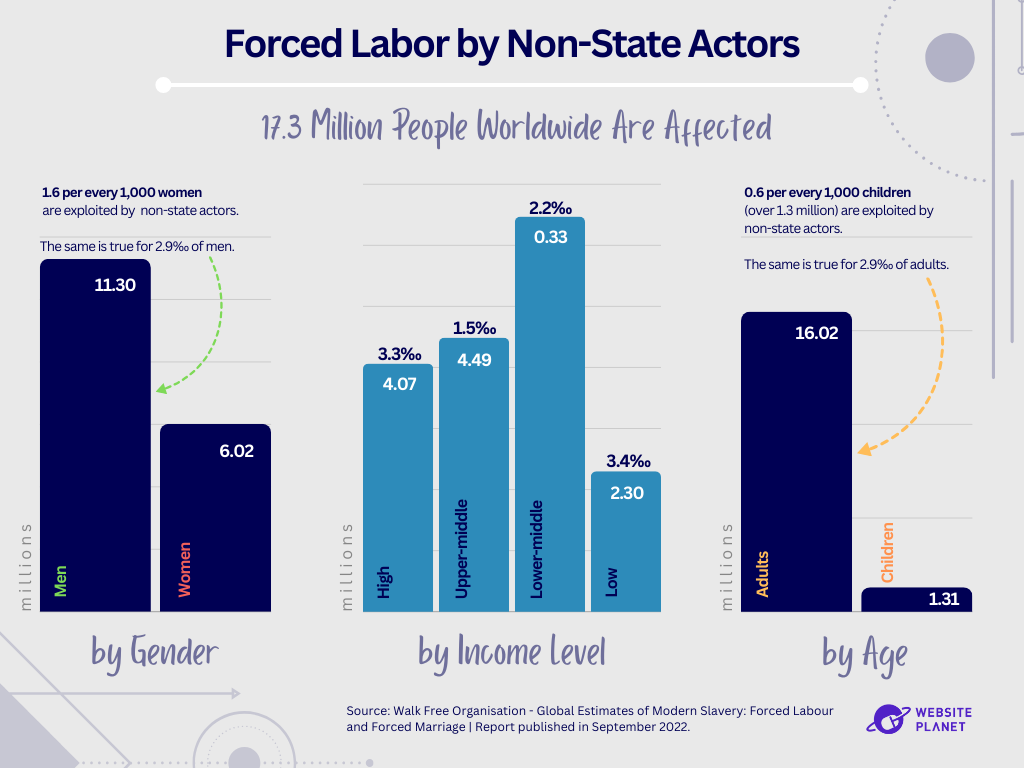 As to where they are enslaved, only 13% of all victims of privately-imposed forced labor are exploited in low-income countries. In fact, high-income and upper-middle-income nations account for 24% and 26% of forced workers, respectively. This means that lower-middle-income countries have the largest number of people, which other non-state agents exploit.
Incidentally, low-income countries are also the ones that have the highest prevalence rate, with 3.4 out of every 1,000 residents being victims of privately-imposed forced labor. High-income countries are a close second, with a prevalence rate of 3.3‰.
With slavery being illegal almost everywhere, privately-sponsored forced labor usually takes the form of labor trafficking. This is where criminals pose as employment agents to subject victims to working without pay.
This happened, for instance, during the construction of Qatar’s World Cup stadiums. The private construction companies contracted to build stadiums and other critical infrastructure for the biggest sporting event in the world used employment agents to source employees from Asia and Africa.
These agents charged the workers exorbitant “processing” fees, confiscated their passports upon arrival, withheld their wages, and subjected them to inhumane working and living conditions. Thousands of workers died, and thousands more returned home with much less than they were promised.
While private entities were the ones who directly exploited the workers, the Qatari government is complicit through its reluctance to enforce basic labor and human rights standards for its migrant workforce.
As to where they are enslaved, only 13% of all victims of privately-imposed forced labor are exploited in low-income countries. In fact, high-income and upper-middle-income nations account for 24% and 26% of forced workers, respectively. This means that lower-middle-income countries have the largest number of people, which other non-state agents exploit.
Incidentally, low-income countries are also the ones that have the highest prevalence rate, with 3.4 out of every 1,000 residents being victims of privately-imposed forced labor. High-income countries are a close second, with a prevalence rate of 3.3‰.
With slavery being illegal almost everywhere, privately-sponsored forced labor usually takes the form of labor trafficking. This is where criminals pose as employment agents to subject victims to working without pay.
This happened, for instance, during the construction of Qatar’s World Cup stadiums. The private construction companies contracted to build stadiums and other critical infrastructure for the biggest sporting event in the world used employment agents to source employees from Asia and Africa.
These agents charged the workers exorbitant “processing” fees, confiscated their passports upon arrival, withheld their wages, and subjected them to inhumane working and living conditions. Thousands of workers died, and thousands more returned home with much less than they were promised.
While private entities were the ones who directly exploited the workers, the Qatari government is complicit through its reluctance to enforce basic labor and human rights standards for its migrant workforce.
State-Imposed Forced Labor
This type of modern slavery affects approximately 3.9 million people globally. For the most part, state-imposed forced labor follows the same pattern as privately-imposed forced labor. It is very male-dominated (78% vs. 22%) and has a very low — though not insignificant — children participation rate (8%). The main difference comes down to where the victims are exploited.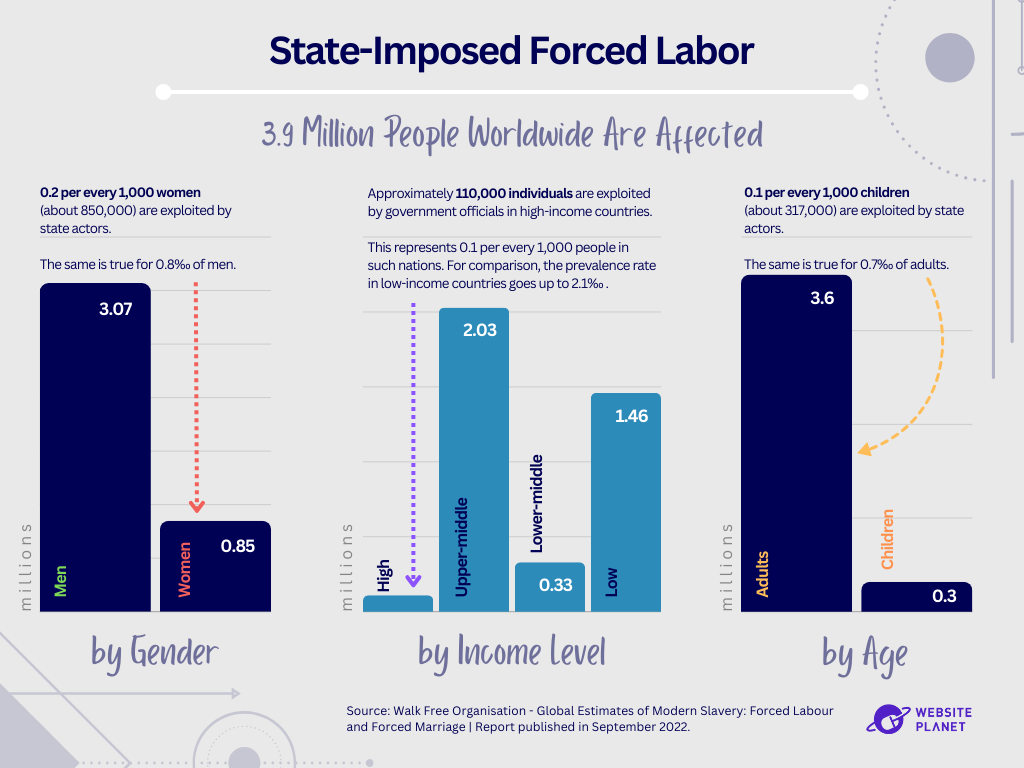 While almost a quarter of slave laborers exploited by the private sector are in high-income countries, only 3% of state-imposed forced laborers are in wealthy nations. As for the rest, 51% are in upper-middle-income states, 8% are in lower-middle-income nations, and the remaining 38% are in low-income countries.
Now, although the bulk of state-imposed forced labor happens in upper-middle-income nations, low-income countries have the highest prevalence rate (2.1‰). In other words, the majority of the people who are exploited by the government are located in upper-middle-income countries, but people in low-income nations have a higher chance of being forced to work by the government’s orders.
A modern-day example of state-imposed forced labor is happening in China’s Xinjiang province. The Uighurs — a religious and ethnic minority group who live there — are facing persecution, ostensibly for their failure to “assimilate.”
More than 1 million Uighurs are in detention camps where, among other injustices, they are forced to work in factories. Under the government’s orders, they manufacture clothing, consumer electronics, pharmaceuticals, and other goods for China’s domestic and export markets.
There are other modern-day examples, including some happening in the United States. Back in 2019 and 2020, two class action lawsuits were filed against the states of Arizona and California. While the specifics are slightly different, both actions allege that the states practice slavery when sending prisoners to private prisons where they are forced to work without pay for the monetary benefit of the prison shareholders and its executive management.
While almost a quarter of slave laborers exploited by the private sector are in high-income countries, only 3% of state-imposed forced laborers are in wealthy nations. As for the rest, 51% are in upper-middle-income states, 8% are in lower-middle-income nations, and the remaining 38% are in low-income countries.
Now, although the bulk of state-imposed forced labor happens in upper-middle-income nations, low-income countries have the highest prevalence rate (2.1‰). In other words, the majority of the people who are exploited by the government are located in upper-middle-income countries, but people in low-income nations have a higher chance of being forced to work by the government’s orders.
A modern-day example of state-imposed forced labor is happening in China’s Xinjiang province. The Uighurs — a religious and ethnic minority group who live there — are facing persecution, ostensibly for their failure to “assimilate.”
More than 1 million Uighurs are in detention camps where, among other injustices, they are forced to work in factories. Under the government’s orders, they manufacture clothing, consumer electronics, pharmaceuticals, and other goods for China’s domestic and export markets.
There are other modern-day examples, including some happening in the United States. Back in 2019 and 2020, two class action lawsuits were filed against the states of Arizona and California. While the specifics are slightly different, both actions allege that the states practice slavery when sending prisoners to private prisons where they are forced to work without pay for the monetary benefit of the prison shareholders and its executive management.
Forced Commercial Sexual Exploitation
Approximately 6.3 million people are exploited as commercial sex workers. Unlike other types of forced labor, commercial sexual exploitation disproportionately affects female victims (78% vs. 22%). In terms of age, 1 out of every 4 victims is a child (under 18 years of age).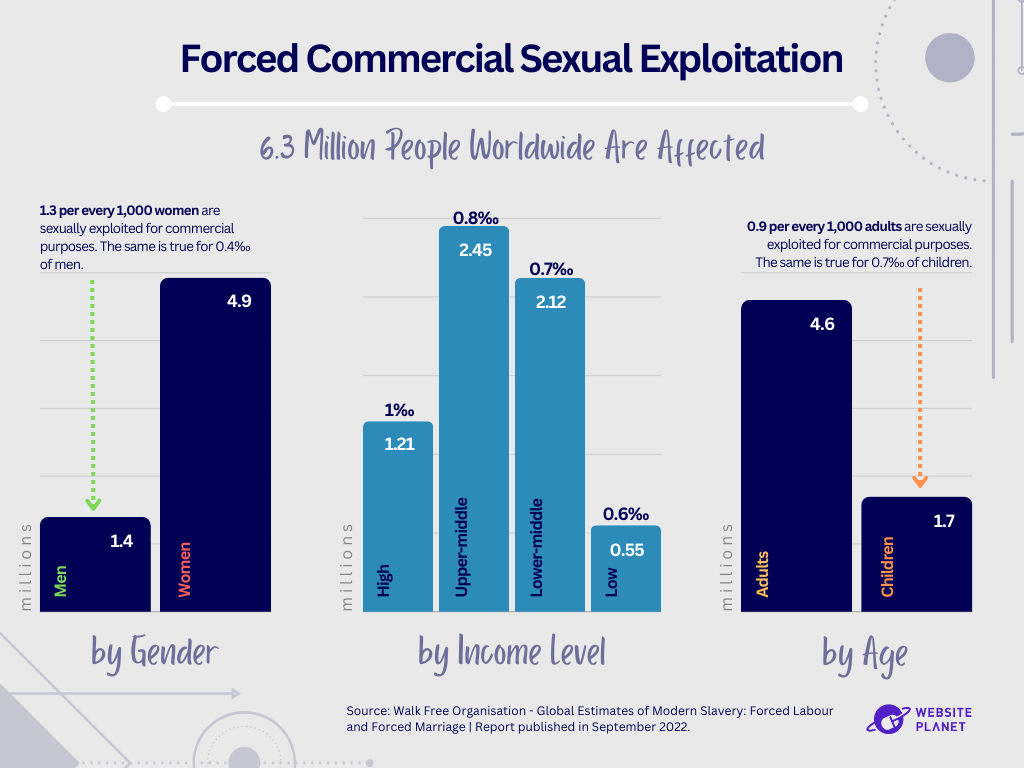 As for where they are enslaved, more than 70% of all victims of forced commercial sexual exploitation are in upper- or lower-middle-income countries; 19% are in high-income nations, and the remaining 9% are exploited in low-income countries.
A possible explanation is that middle-income countries strike a “good” balance regarding law enforcement gaps and a relatively wealthy economy, which makes them favorable for sexual slavery.
For comparison, low-income nations tend to have lax law enforcement structures, but poverty makes them subpar markets for criminal slave rings. High-income countries, on the other hand, are lucrative markets for criminal slave rings, but they usually have robust law enforcement and criminal justice systems, which are a deterrent for commercial sexual exploitation.
However, we find the highest prevalence rate of forced commercial sexual slavery in high-income countries, with 1 out of every 1,000 residents being exploited as sex workers.
As for where they are enslaved, more than 70% of all victims of forced commercial sexual exploitation are in upper- or lower-middle-income countries; 19% are in high-income nations, and the remaining 9% are exploited in low-income countries.
A possible explanation is that middle-income countries strike a “good” balance regarding law enforcement gaps and a relatively wealthy economy, which makes them favorable for sexual slavery.
For comparison, low-income nations tend to have lax law enforcement structures, but poverty makes them subpar markets for criminal slave rings. High-income countries, on the other hand, are lucrative markets for criminal slave rings, but they usually have robust law enforcement and criminal justice systems, which are a deterrent for commercial sexual exploitation.
However, we find the highest prevalence rate of forced commercial sexual slavery in high-income countries, with 1 out of every 1,000 residents being exploited as sex workers.
The Flux of Forced Labor
As of 2021, privately-imposed forced labor was responsible for the bulk (63%) of forced labor globally, followed by state-imposed forced labor (23%) and forced commercial sex exploitation (14%). Comparing forced labor statistics from 2016 and 2021, we can see an increase in privately-imposed forced labor and forced commercial sexual exploitation. This is consistent with the data we shared in the first chapter, which showed modern slavery is trending upwards.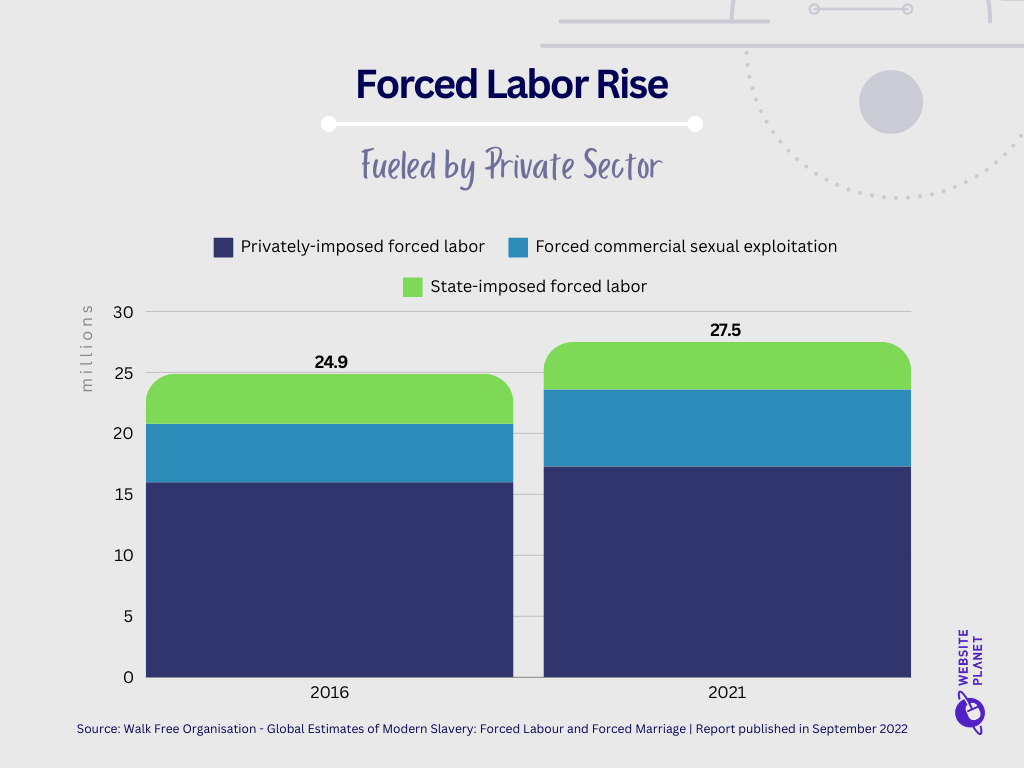 However, during the same period, the number of state-imposed forced labor victims significantly reduced. As modern slavery gets more attention from people and organizations around the globe, governments seem to be cutting back on inhumane exploitation, lest they are ostracized by the international community.
Uzbekistan is a good example of how effective international pressure can be. Previously, the government used forced laborers (including children) for their massive annual cotton harvest. Yet, in 2021, international pressure and threats of economic sanctions proved to be a successful incentive for the country to drastically decrease its reliance on modern slavery. Nowadays, forced labor in Uzbekistan is almost imperceptible.
However, during the same period, the number of state-imposed forced labor victims significantly reduced. As modern slavery gets more attention from people and organizations around the globe, governments seem to be cutting back on inhumane exploitation, lest they are ostracized by the international community.
Uzbekistan is a good example of how effective international pressure can be. Previously, the government used forced laborers (including children) for their massive annual cotton harvest. Yet, in 2021, international pressure and threats of economic sanctions proved to be a successful incentive for the country to drastically decrease its reliance on modern slavery. Nowadays, forced labor in Uzbekistan is almost imperceptible.
Where Is Forced Labor More Prevalent?
More than half (55%) of all victims of forced labor are exploited in the Asia-Pacific region. This is probably because the region accounts for most of the global population. After all, 4 of the 5 most populous countries in the world are Asian, with the population in India and China exceeding 1 billion each. In terms of global distribution, Europe and Central Asia follow as a distant second (15%), then Africa (14%), the Americas (13%), and the Arab states (3%). Interestingly enough, the region with the fewest people experiencing forced labor is also the one that has the highest prevalence rate, with 5.3 out of every 1,000 residents being exploited.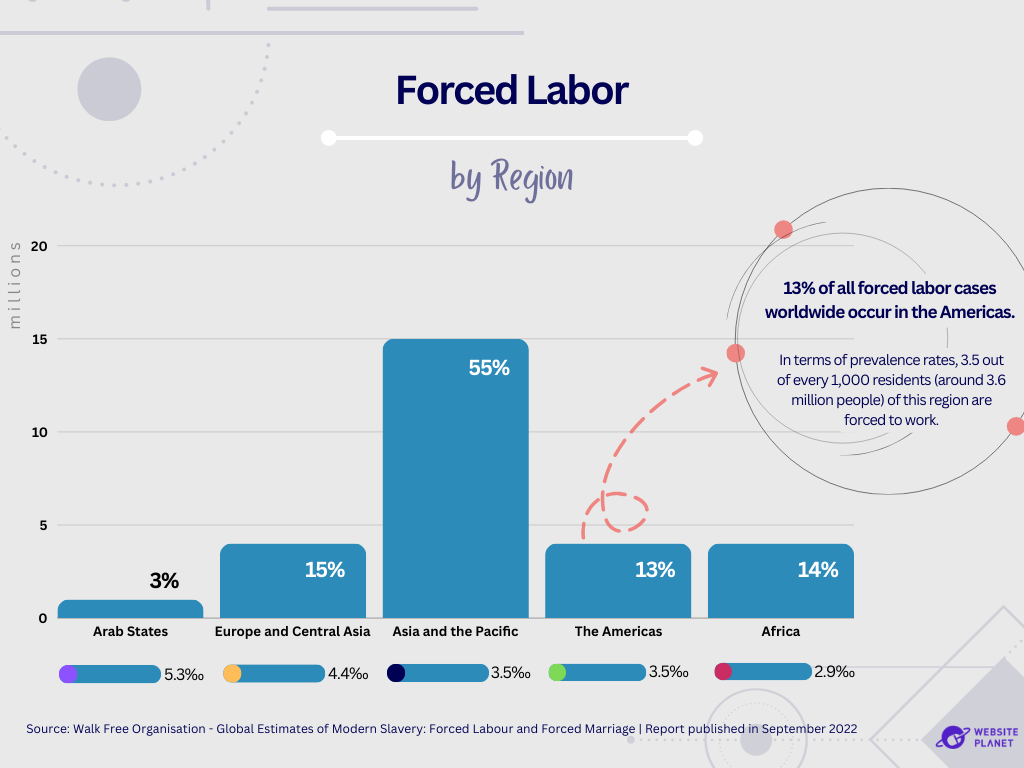 Now, we can spot a similar trend if we look at the geographical distribution of forced laborers categorized by nations’ income instead of by region. It seems like the higher the percentage distribution, the lower the prevalence rate is.
As we mentioned above, middle-income countries have fairly robust economies and relatively inefficient law-enforcement systems. This creates a conducive environment for modern slavery, which translates into a high percentage distribution of forced labor.
Now, we can spot a similar trend if we look at the geographical distribution of forced laborers categorized by nations’ income instead of by region. It seems like the higher the percentage distribution, the lower the prevalence rate is.
As we mentioned above, middle-income countries have fairly robust economies and relatively inefficient law-enforcement systems. This creates a conducive environment for modern slavery, which translates into a high percentage distribution of forced labor.
 Upper-middle-income and lower-middle-income countries account for one-third of forced labor cases each, yet they boast the lowest prevalence rates in the graph (3‰). Low-income nations, on the other hand, have half the percentage distribution and double the prevalence rate than middle-income countries. This is likely because people in low-income countries are typically more vulnerable to exploitation.
Who Is More Likely to Be Caught in Forced Labor?
Immigrant workers are more likely to be victims of forced labor than their non-immigrant counterparts, especially if they are illegal migrants who receive little protection from legal systems. Regarding the prevalence of forced labor in the adult workforce, 13.8 out of every 1,000 migrant workers are forced laborers, whereas 4.1 out of every 1,000 non-migrant workers are subjected to forced labor.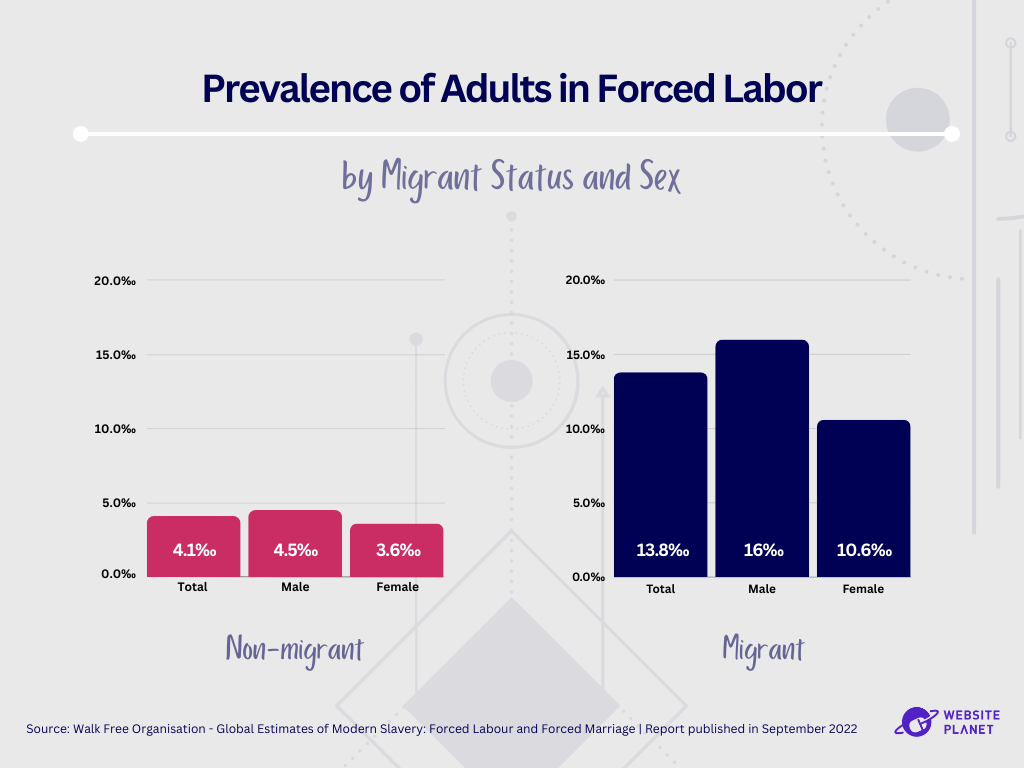 Regions with a high migrant worker population, like the Arab States, have the highest forced labor prevalence rates.
The numbers also show a higher slavery prevalence rate for males than females, regardless of their migration status.
Regions with a high migrant worker population, like the Arab States, have the highest forced labor prevalence rates.
The numbers also show a higher slavery prevalence rate for males than females, regardless of their migration status.
What Type of Work Are Adults Forced to Do?
Victims of forced labor are often exploited in economic sectors that require “unskilled” labor, such as mining and quarrying, the agricultural sector, and domestic work. Globally, the top 3 industries that utilize forced laborers are non-domestic services, which account for 32% of all cases, followed by manufacturing (18.7%) and construction (16.3%).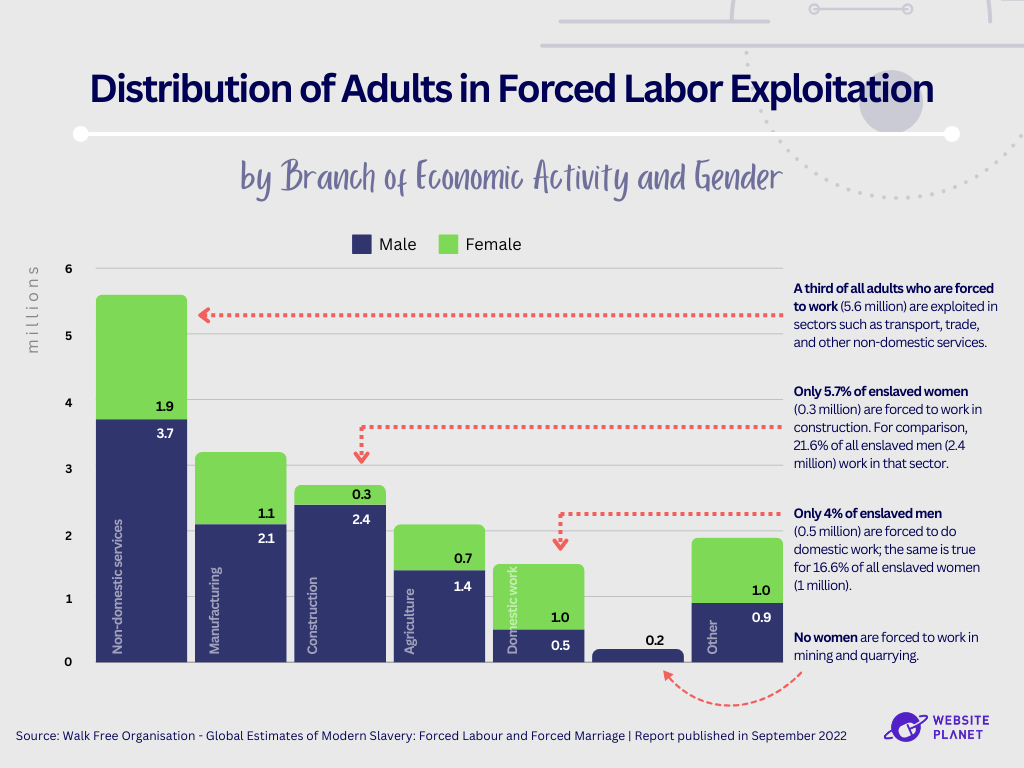 Most of these sectors are male-dominated. In fact, barring commercial sexual exploitation, the only two sectors where most victims are female are domestic work and the hard-to-define “other” sector, which includes begging and various criminal activities.
On the other hand, mining and quarrying is the most male-dominated economic sector of the list, with virtually 100% of all forced laborers being men, followed by the construction industry, which is 86% male-dominated.
Now, let’s add another layer to the analysis: job desirability. We can gain insight into modern slavery by comparing its economic sector distribution against voluntary labor.
For instance, Construction and Manufacturing are two sectors with the highest number of forced workers and the lowest share of voluntary workers. Both are physically grueling sectors that require intensive manual work, which makes them unattractive to voluntary workers, especially in higher-income nations.
Most of these sectors are male-dominated. In fact, barring commercial sexual exploitation, the only two sectors where most victims are female are domestic work and the hard-to-define “other” sector, which includes begging and various criminal activities.
On the other hand, mining and quarrying is the most male-dominated economic sector of the list, with virtually 100% of all forced laborers being men, followed by the construction industry, which is 86% male-dominated.
Now, let’s add another layer to the analysis: job desirability. We can gain insight into modern slavery by comparing its economic sector distribution against voluntary labor.
For instance, Construction and Manufacturing are two sectors with the highest number of forced workers and the lowest share of voluntary workers. Both are physically grueling sectors that require intensive manual work, which makes them unattractive to voluntary workers, especially in higher-income nations.
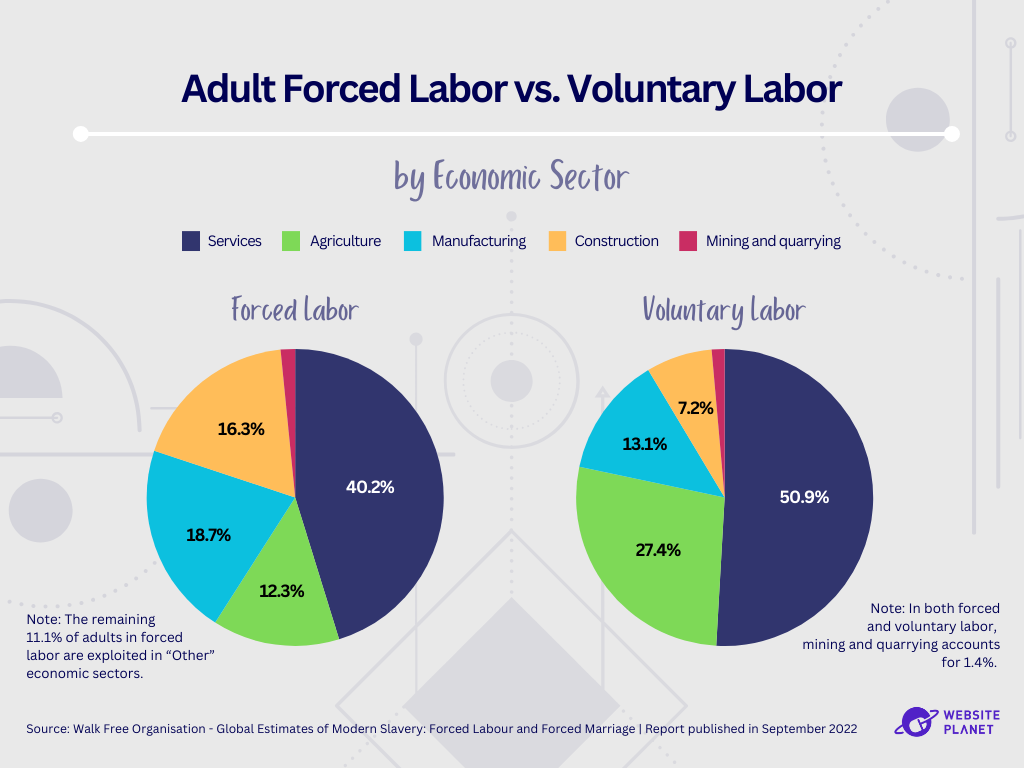 So, men in forced labor are brought in to take over the work that needs to be done. For instance, the data suggests that 16.3% of adults in forced labor are taking care of Construction tasks—a job that only 7.2% of voluntary workers signed up for.
Forced Labor Cases, Private Actors, and Legal Measures
Over the past decades, multiple well-known brands have made global news with their alleged involvement with modern slavery cases. Back in 2001, accusations were made against Adidas, which allegedly produced its garments in two factories in Asia where people were overworked, underpaid, and sometimes underage.
In recent years, Nestlé and Starbucks were each sued for sourcing some of their ingredients from farms (in countries such as Brazil, Guatemala, Kenya, Ivory Coast, and Mali) where workers are known to be exploited. Both brands claimed to be deeply concerned by the allegations and publicly reinstated their commitment to ethical sourcing.
Alas, this does not mean the end of the problem. At least 83 multinational brands have been linked to modern slavery practices in China alone — the total number of companies that profit from forced labor is likely much bigger.
What About Children in Forced Labor?
Approximately 39% of all child victims are exploited by private agents, 10% are in state-imposed forced labor, and a troubling 51% are subjected to commercial sexual exploitation. Although adults make up the vast majority of forced commercial sexual exploitation victims, it is children who are actually more vulnerable to this type of modern slavery. The statistics for all forced labor victims (adults and children) show that about 14% of them are sexually exploited. For comparison, 1.69 million of the 3.3 million children who are victims of forced labor are sexually abused.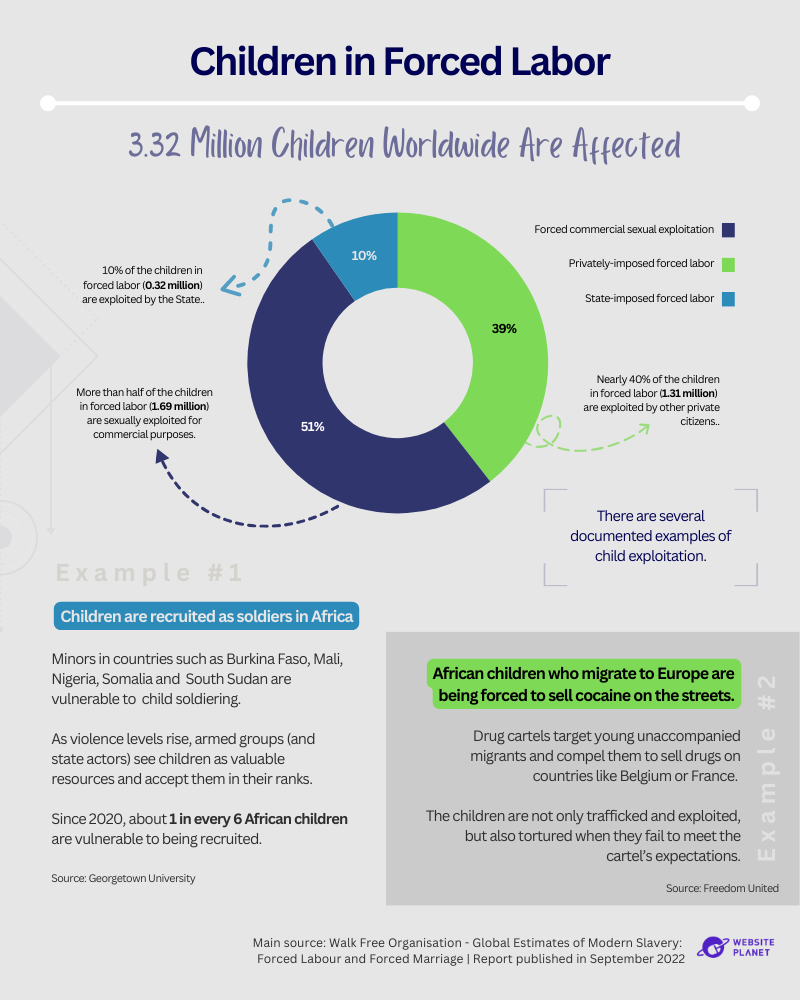 However, sexual exploitation is not actually the biggest threat to enslaved children. Of all forms of modern slavery, forced marriage has the highest rate of child victims.
Forced Marriage
A forced marriage occurs when at least one of the parties does not consent to the union. It is considered a form of slavery because victims are denied agency and choice. In most cases, a non-consensual marriage involves forced labor and sexual exploitation as well. A forced marriage is often a life sentence of violence, exploitation, and abuse that is protected by both official and informal societal and cultural structures. The victim’s family is usually complicit, especially in cases involving children. For instance, some families receive some form of dowry or compensation to compel them to accept the union.Who Is Forced to Marry?
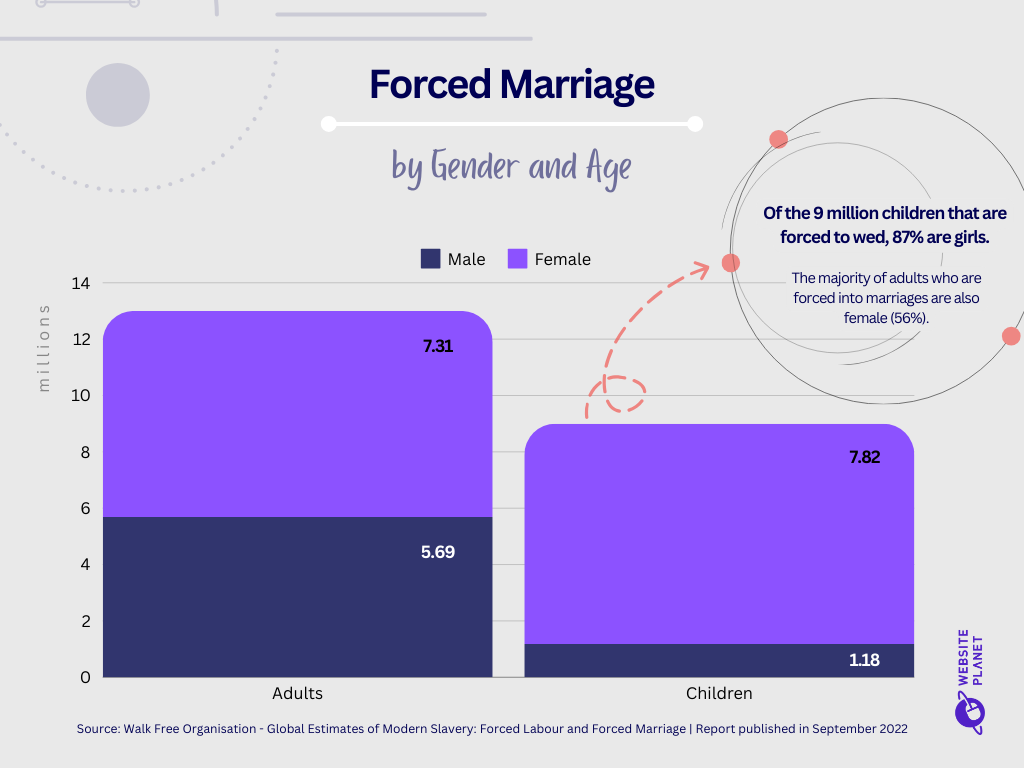
Forced marriage is a global issue that affects approximately 22 million victims, with a prevalence rate of 2.8‰ — that is, basically, 3 out of every 1,000 people around the world are forced to marry. In terms of age distribution, forced marriage affects more adults than children (59% of individuals in forced marriages are considered adults), but children face a higher prevalence rate. As we mentioned above, forced marriage has the highest rate of child victims of all forms of slavery.
Looking closer, it’s evident that forced marriage disproportionately affects the female gender. Not only do women suffer a higher prevalence rate than their male counterparts (3.9‰ vs. 1.8‰), but 2 out of every 3 victims of forced marriages are female, and almost 9 out of every 10 child victims are girls.
In terms of age distribution, forced marriage affects more adults than children (59% of individuals in forced marriages are considered adults), but children face a higher prevalence rate. As we mentioned above, forced marriage has the highest rate of child victims of all forms of slavery.
Looking closer, it’s evident that forced marriage disproportionately affects the female gender. Not only do women suffer a higher prevalence rate than their male counterparts (3.9‰ vs. 1.8‰), but 2 out of every 3 victims of forced marriages are female, and almost 9 out of every 10 child victims are girls.
 This gender pattern can be explained, in part, because forced marriage is often more prevalent in communities with strong “traditional” patriarchal societal structures that emphasize the woman’s role as a wife. Young girls are forced to marry, while their male siblings usually get an education and pursue employment.
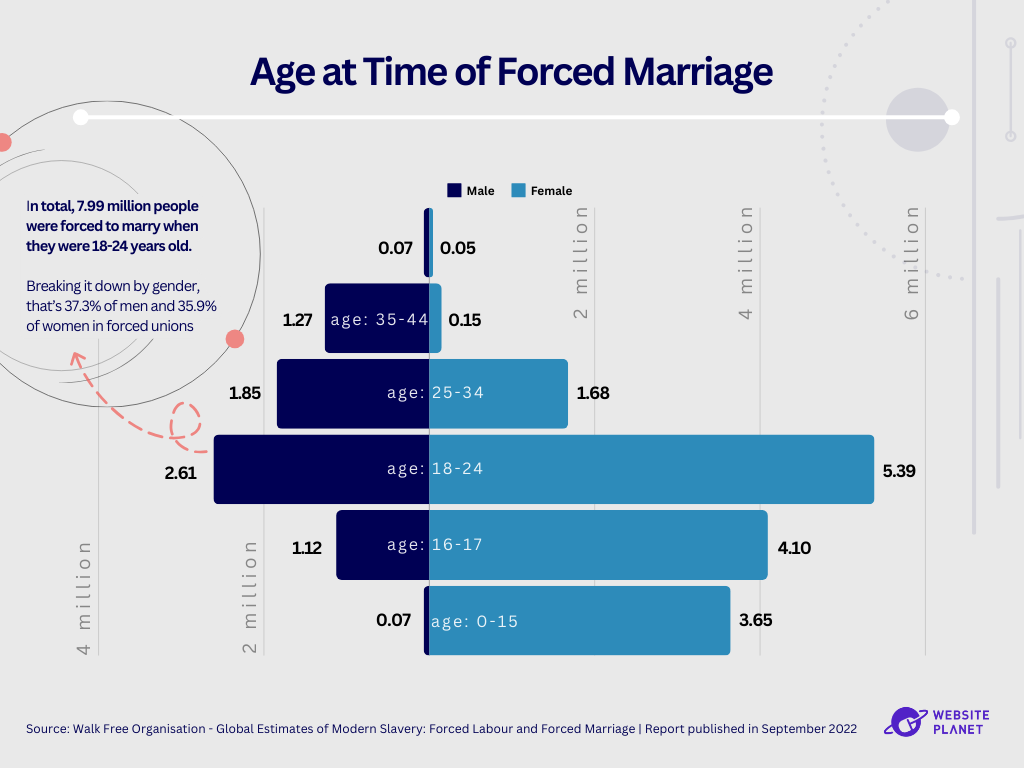 Looking at the distribution by age group, we can see that people are more likely to enter forced unions when they are 18-24 years old. However, when we consider gender, we see that over 80% of women were forced to marry before they turned 25, with 51.6% of the brides being underage when the wedding took place. For comparison, over 80% of the grooms were legally adults when they were forced to wed.
In other words, younger age groups are female-dominated, whereas the older ones are male-dominated. This brings us back to the issue of traditional gender roles in patriarchal societies — the expectation for young girls is to accept their role as wives and homemakers early on, while men are pressured to assume their role as providers as they grow older.
Looking at the distribution by age group, we can see that people are more likely to enter forced unions when they are 18-24 years old. However, when we consider gender, we see that over 80% of women were forced to marry before they turned 25, with 51.6% of the brides being underage when the wedding took place. For comparison, over 80% of the grooms were legally adults when they were forced to wed.
In other words, younger age groups are female-dominated, whereas the older ones are male-dominated. This brings us back to the issue of traditional gender roles in patriarchal societies — the expectation for young girls is to accept their role as wives and homemakers early on, while men are pressured to assume their role as providers as they grow older.
Where Are People Forced to Marry?
The Asia-Pacific region accounts for most forced marriages, as almost 7 out of every 10 victims of forced marriage are in the region, totaling 14.2 million victims. It also has the second-highest prevalence rate, surpassed only by the Arab States. Interestingly, although the Arab region has the highest prevalence rate (4.8 out of every 1,000 residents are in forced marriages), the region accounts for the smallest percentage of total cases (4%).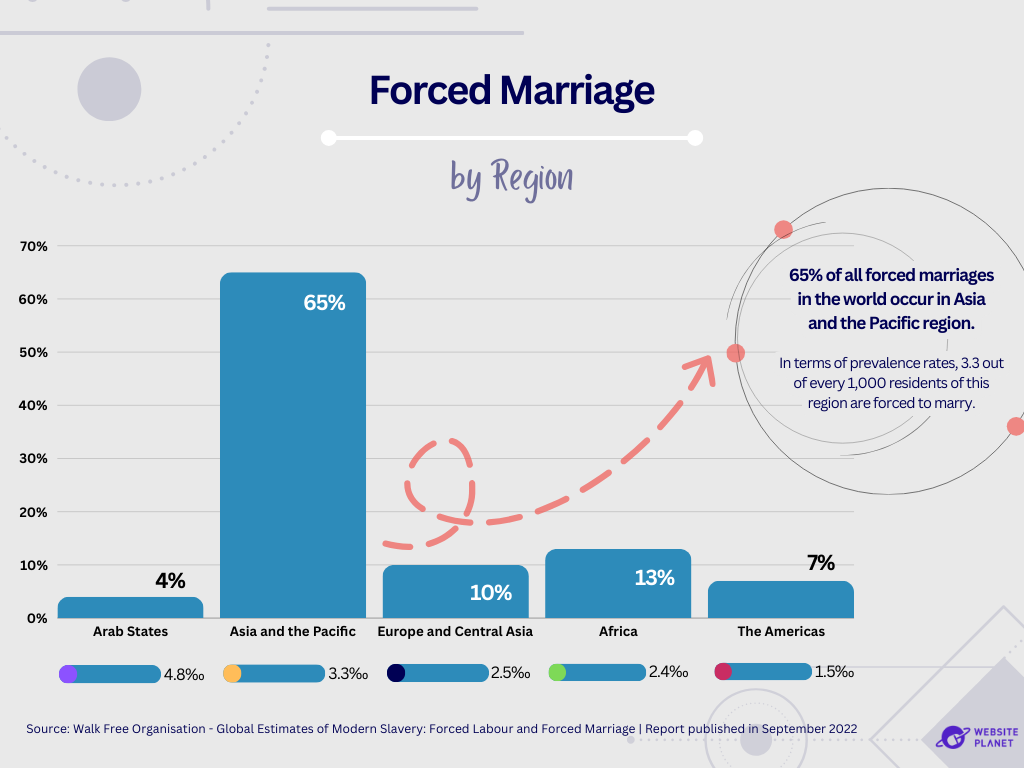 Regarding the national income level, the majority of forced marriage victims are in lower-middle-income countries (64%), followed by upper-middle-income countries (17%), then low-income countries (10%), and finally high-income countries (8%).
The fact that the latter have the lowest number of victims is probably expected, given their usually strong governance structures and non-vulnerable populations. However, based on the same hypothesis, low-income countries should have the highest number of victims, yet that is not the case.
This suggests that poverty is not the main factor behind forced marriages. Africa and the Americas have many low-income countries, yet they have the lowest forced marriage prevalence rates (2.4‰ and 1.5‰, respectively).
In fact, it is probably cultural factors that play a much more significant role in the occurrence of forced marriages. These cultural factors include traditional practices such as marriage by abduction, marriage as a form of debt payment or dispute resolution, or marriage as a consequence of unplanned pregnancy.
Cultures where arranged marriages are commonplace also see a higher rate of forced marriages. Arranged marriages are unions where both partners consent to their families choosing who they’ll marry. If one is coerced or threatened to go with their family’s decision, then the union is considered a forced marriage.
Regarding the national income level, the majority of forced marriage victims are in lower-middle-income countries (64%), followed by upper-middle-income countries (17%), then low-income countries (10%), and finally high-income countries (8%).
The fact that the latter have the lowest number of victims is probably expected, given their usually strong governance structures and non-vulnerable populations. However, based on the same hypothesis, low-income countries should have the highest number of victims, yet that is not the case.
This suggests that poverty is not the main factor behind forced marriages. Africa and the Americas have many low-income countries, yet they have the lowest forced marriage prevalence rates (2.4‰ and 1.5‰, respectively).
In fact, it is probably cultural factors that play a much more significant role in the occurrence of forced marriages. These cultural factors include traditional practices such as marriage by abduction, marriage as a form of debt payment or dispute resolution, or marriage as a consequence of unplanned pregnancy.
Cultures where arranged marriages are commonplace also see a higher rate of forced marriages. Arranged marriages are unions where both partners consent to their families choosing who they’ll marry. If one is coerced or threatened to go with their family’s decision, then the union is considered a forced marriage.
How Are People Coerced Into Marriage?
There must be a form of coercion or pressure to make someone get married against their will. Looking at the entire population of forced marriage victims: 53% were coerced through emotional threats and verbal abuse, 19% through physical or sexual violence or threats of such violence, and 10% were kidnapped or trafficked. These were the top 3 forms of pressure forced spouses had to endure.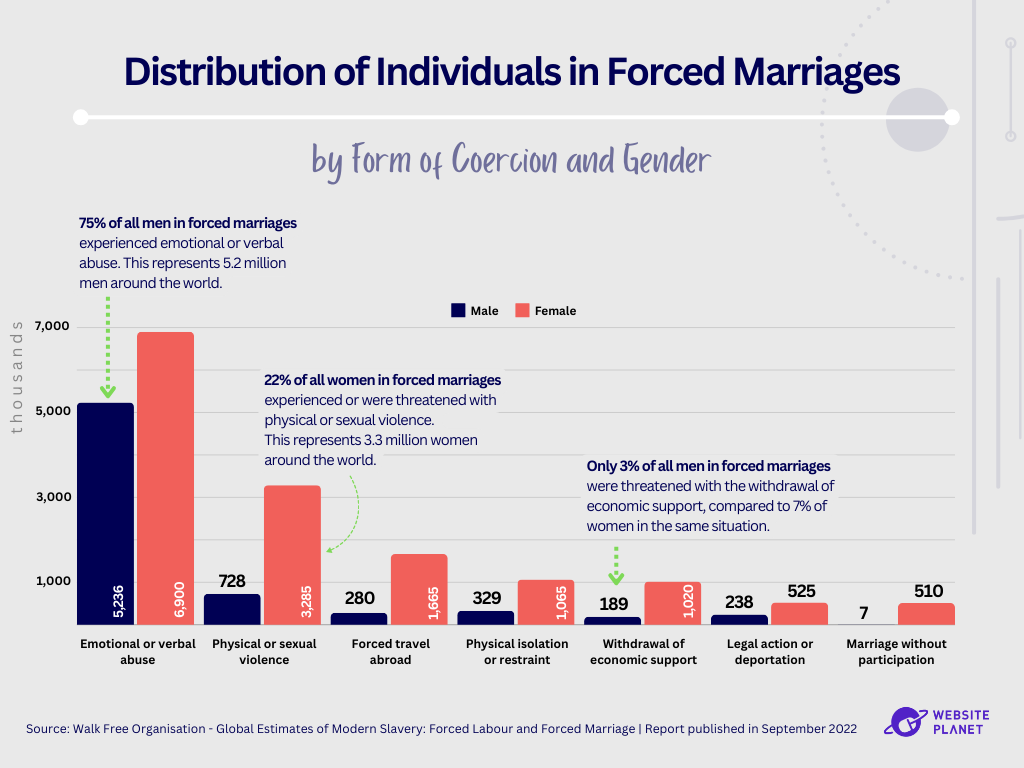 Looking at coercion through a gender lens, we see that emotional threats and verbal abuse are the most common forms of coercion for both men and women; however, it seems to affect men on a larger scale. About 75% of men claim verbal abuse drove them into a forced marriage, compared to just 46% of women. In other words, women appear to be vulnerable to multiple threats and violent acts, whereas men seem to have one major pressure point.
Women are twice more likely to endure physical or sexual violence than men; they’re also significantly more susceptible to threats of withdrawal of financial support. This shows that they are likely located in societies where they don’t have the opportunity to be financially independent.
Interestingly, men are almost never wed without their knowledge, yet that’s what happens to 3.4% of female victims.
Looking at coercion through a gender lens, we see that emotional threats and verbal abuse are the most common forms of coercion for both men and women; however, it seems to affect men on a larger scale. About 75% of men claim verbal abuse drove them into a forced marriage, compared to just 46% of women. In other words, women appear to be vulnerable to multiple threats and violent acts, whereas men seem to have one major pressure point.
Women are twice more likely to endure physical or sexual violence than men; they’re also significantly more susceptible to threats of withdrawal of financial support. This shows that they are likely located in societies where they don’t have the opportunity to be financially independent.
Interestingly, men are almost never wed without their knowledge, yet that’s what happens to 3.4% of female victims.
Child Marriage
Child marriage is any formal or informal union where at least one of the spouses is under the age of 18. It is considered a form of forced marriage given that underage participants cannot express full and informed consent to the union. According to UNICEF, the number of child brides in the world currently stands at 650 million. This number includes both girls under 18 who have already married and adults who married when they were children.Where Is Child Marriage Most Common?
Even though it is a blatant violation of human rights, child marriage remains a common occurrence in many parts of the world. The region of West and Central Africa has the highest rate of child marriage, with around 11% of girls getting married before they turn 15, and 32% of girls being married by the time they turned 18. That is followed by Eastern and Southern Africa, with 30% of girls under 18 falling in this category. The prevalence of child marriage in Africa can be explained by severe poverty and extreme gender inequality. In many families, child marriage is seen as a way to reduce family costs by having “one less mouth to feed”. Furthermore, in some cultures, the younger the girl is, the less dowry the bride’s family has to pay to the groom’s family, which could also be one of the reasons girls are married at such a young age.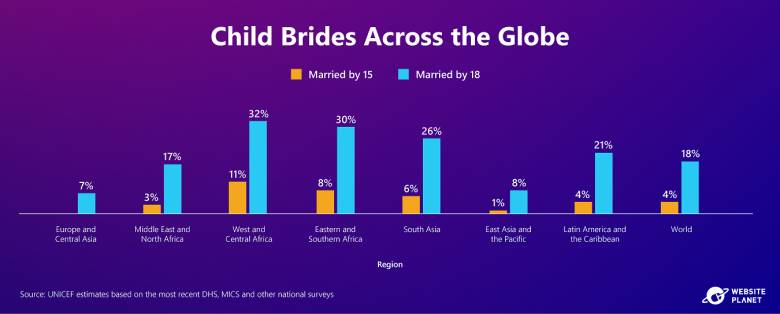 Overall, UNICEF estimates 4% of girls under 15 and 18% of girls under 18 were child brides between 2015-2023.
Although UNICEF does not provide official data for North America, girls in the US and Canada are also at risk of becoming child brides. For instance, Equality Now estimates that 300,000 children have gotten married in the US since the year 2000, as 20 U.S. states do not require any minimum age for marriage, with a parental or judicial waiver. As for Canada, at least 3,382 children have been awarded a marriage license since the turn of the century.
How Prevalent is Child Marriage Among Boys?
Even though child marriage is a practice that disproportionately affects girls, boys are also affected in many parts of the world. In UNICEF’s 2019 first-ever in-depth analysis of child marriage among boys, 115 million child grooms under 18 were identified worldwide. Boys as young as 15 are forced to assume the traditional role of providers for the family, resulting in missed education and job opportunities. Below, you can see the prevalence of child marriage among boys compared to girls in different parts of the world.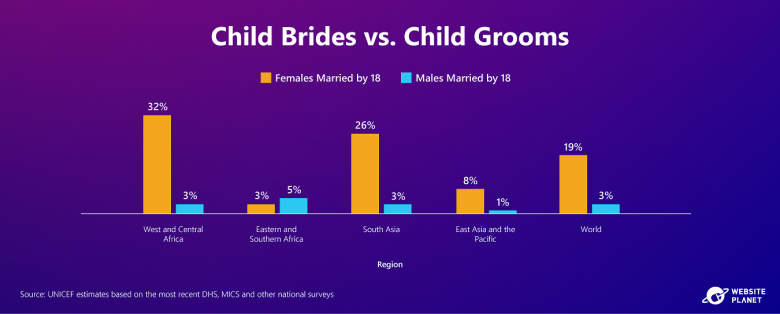 Overall, 3% of boys under 18 became child grooms in 2015-2022. Although this figure is decidedly smaller than the percentage of girls who became child brides (19%) during roughly the same period, it is not an insignificant number — it represents 115 million boys worldwide.
The Global Slavery Index (GSI)
The global slavery index looks at slavery on a country-by-country basis. The index uses three broad measurements to contextualize how a country is affected by and responds to the scourge of modern slavery. These are:- Prevalence: This is a straightforward metric that counts how many people, out of a thousand residents, are victims of modern slavery. A prevalence score exceeding 15 is concerning; a 50+ prevalence score belongs to a country where modern slavery is a big problem. A 100+ prevalence score means that rampant modern slavery has permeated all aspects of a country’s society.
- Vulnerability Score: This measures how “at-risk” a country’s residents are of becoming victims of slavery. It considers many factors, including political stability, wealth inequality/extreme poverty, disenfranchised groups, violent crime rate, terrorism, internal conflict, and war.
- Government Response: This scores a government’s efforts to recognize and respond to modern slavery. The score considers factors like survivor support, the effectiveness of its criminal justice system, the ratification of international anti-slavery conventions, the availability of safety nets for at-risk populations, and the overall efforts a government makes to protect its residents from modern slavery.
The countries that were excluded from the 2023 GSI report are: Dominica, Eswatini, Fiji, Grenada, Kiribati, Malta, Nauru, Saint Kitts and Nevis, Samoa, Seychelles, Tahiti, Tonga, and Tuvalu.
-
Prevalence Score
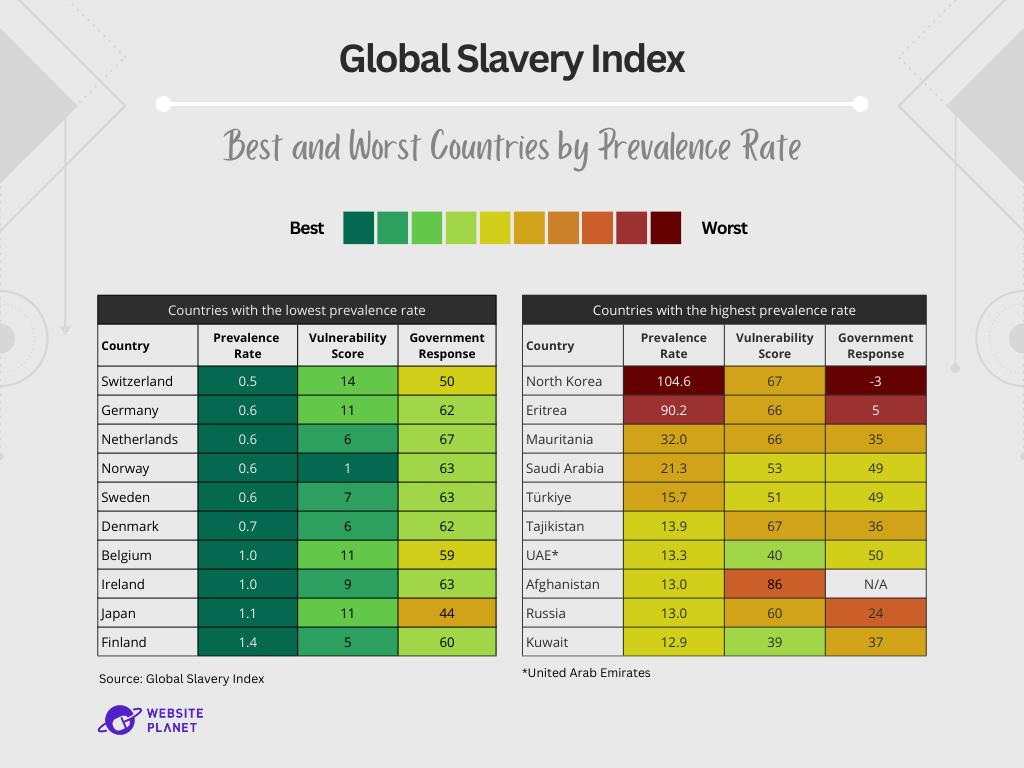 North Korea (D.P.R.K.) has the highest modern slavery prevalence rate in the world (104.6‰). This means that slightly more than 10% of all North Koreans are victims of slavery. Eritrea is a close second, with a prevalence rate of 90.2‰ (which is lower than it was five years before when it reached 93‰). Mauritania comes at a distant third on the list (32‰).
Unlike in Eritrea, Russia’s numbers have become more concerning over the past few years. Back in 2018, its prevalence rate was about 5.5‰, and its vulnerability was down to 52. This means that the number of modern slavery victims in Russia more than doubled in these five years.
Nowadays, the population is theoretically more at risk than it was before, reaching a “concerning” level according to its most recent score (60). The reason for this could be the ongoing war in Ukraine plus the economic sanctions that have been imposed on this country in response.
Other than Russia, Türkiye (or Turkey), and Mauritania also saw a dramatic increase in their prevalence rates. In 2018, only 6.5 out of every 1,000 Turkish individuals were forced into slavery; now it’s 15.7‰. Similarly, Mauritania went from 21.4‰ all the way to 32‰.
North Korea (D.P.R.K.) has the highest modern slavery prevalence rate in the world (104.6‰). This means that slightly more than 10% of all North Koreans are victims of slavery. Eritrea is a close second, with a prevalence rate of 90.2‰ (which is lower than it was five years before when it reached 93‰). Mauritania comes at a distant third on the list (32‰).
Unlike in Eritrea, Russia’s numbers have become more concerning over the past few years. Back in 2018, its prevalence rate was about 5.5‰, and its vulnerability was down to 52. This means that the number of modern slavery victims in Russia more than doubled in these five years.
Nowadays, the population is theoretically more at risk than it was before, reaching a “concerning” level according to its most recent score (60). The reason for this could be the ongoing war in Ukraine plus the economic sanctions that have been imposed on this country in response.
Other than Russia, Türkiye (or Turkey), and Mauritania also saw a dramatic increase in their prevalence rates. In 2018, only 6.5 out of every 1,000 Turkish individuals were forced into slavery; now it’s 15.7‰. Similarly, Mauritania went from 21.4‰ all the way to 32‰.
-
Vulnerability Score
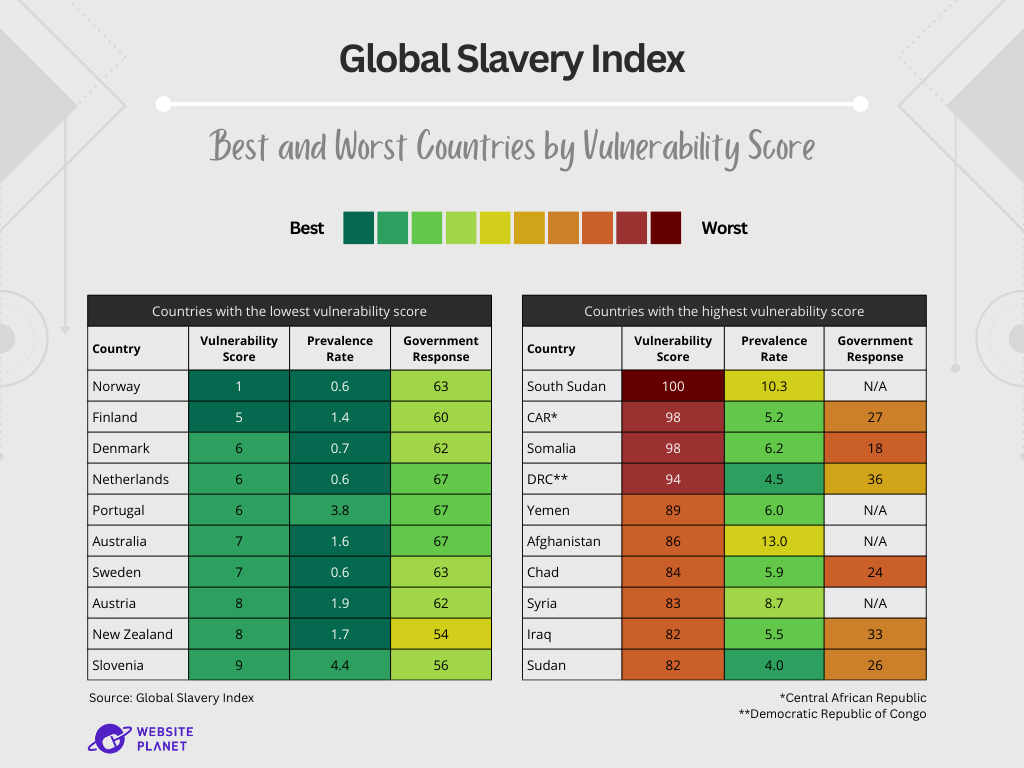 On the other hand, the countries with the highest vulnerability scores are concentrated in Central and East Africa and the Middle East. South Sudan, with the highest possible vulnerability score (100), is at the top of this list.
Interestingly, none of the most vulnerable countries have a high prevalence rate — not even the ones with indeterminable government response scores surpass the 15‰ mark.
On the other hand, the countries with the highest vulnerability scores are concentrated in Central and East Africa and the Middle East. South Sudan, with the highest possible vulnerability score (100), is at the top of this list.
Interestingly, none of the most vulnerable countries have a high prevalence rate — not even the ones with indeterminable government response scores surpass the 15‰ mark.
-
Government Response Score
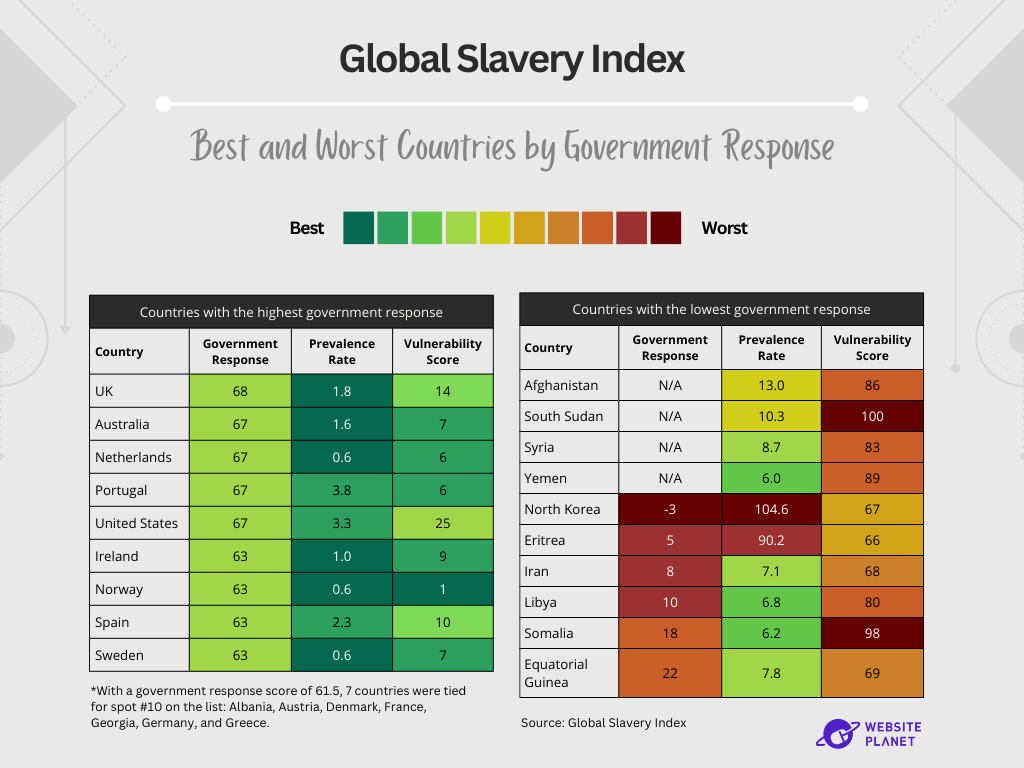 Of all the countries considered in the study, four did not have stable government structures and thus did not get a government response score. The six remaining nations on this list have the lowest government response scores, including the country with the worst vulnerability score (South Sudan) and the one with the worst prevalence rate (North Korea).
As for the reasons behind these countries’ poor government response, Afghanistan, South Sudan, Syria, Yemen, Libya, and Somalia have all experienced war or severe internal conflict over the past decade. Syria and Iran have also been under extensive international sanctions, contributing to economic and political instability.
North Korea, on the other hand, is considered a “rogue state” due to its extremely authoritarian leadership that has stripped the population of most of its personal freedoms. It, too, has borne the brunt of international sanctions for decades. Now, it is the only country in the entire study that earned a negative score due to its poor government response.
Of all the countries considered in the study, four did not have stable government structures and thus did not get a government response score. The six remaining nations on this list have the lowest government response scores, including the country with the worst vulnerability score (South Sudan) and the one with the worst prevalence rate (North Korea).
As for the reasons behind these countries’ poor government response, Afghanistan, South Sudan, Syria, Yemen, Libya, and Somalia have all experienced war or severe internal conflict over the past decade. Syria and Iran have also been under extensive international sanctions, contributing to economic and political instability.
North Korea, on the other hand, is considered a “rogue state” due to its extremely authoritarian leadership that has stripped the population of most of its personal freedoms. It, too, has borne the brunt of international sanctions for decades. Now, it is the only country in the entire study that earned a negative score due to its poor government response.
GSI: Interrelationships and Patterns
It is reasonable to expect the three GSI scores to be related. For example, it would seem logical for a country with a high vulnerability score and a low government response to have a high prevalence rate — and this is largely, but not always, the case. Some countries with the highest prevalence rates (North Korea, Afghanistan, Eritrea) also have high vulnerability scores. Similarly, some countries with the lowest prevalence rates (such as Norway and Sweden) also have low vulnerability scores. However, not all countries are so consistent with their scores. For instance, Syria, Iraq, and Yemen all have high vulnerability scores (over 80) but relatively low prevalence rates (under 10‰). These are politically unstable countries with current or recently resolved armed conflicts, hence the high vulnerability score. Back in 2018, all three countries had a “N/A” as a government response score; now, Iraq boasts a proud 33, likely due to the relative stability and improved social cohesion in the country over the past few years, along with a greater government presence in society. Sadly, Syria and Yemen have not seen such improvement. The fact that government response scores are still unavailable suggests that the low prevalence rate of modern slavery in the area is not due to legal protections afforded to the population. Therefore, should the circumstances continue to be the same, the prevalence rates of these nations are likely to continue rising.The data for this section was sourced from the Global Slavery Index 2023, made available from https://www.walkfree.org/global-slavery-index/ under the Global Slavery Index Data License.
What’s Happening in the Democratic Republic of Congo?
The Democratic Republic of Congo (DRC) also has a high vulnerability score with a low prevalence rate. In fact, it shows a bigger discrepancy between the two measurements, with an over 90 vulnerability and below 5% prevalence. Perhaps the biggest contributor to this phenomenon is the infamous cobalt mining in the country.Background & Quick Facts
Here are some things you need to know about cobalt mining in the DRC:- The country holds approximately 50% of global cobalt reserves and produces over 70% of cobalt worldwide.
- China controls around 75% of the global refined cobalt production, and around 90% of China’s cobalt comes from the DRC.
- Chinese companies own 15 out of 19 copper-cobalt mining operations in the DRC.
- In March 2024, the US Court of Appeals for the District of Colombia absolved Apple, Microsoft, Alphabet (Google), Tesla, and Dell of the accusation that they were “knowingly […] aiding and abetting the cruel and brutal use of young children” in cobalt mining in the DRC.
- Eliminating cobalt mining in the DRC will affect the livelihood of around 200,000 miners.
Documented Cases of Abuse
Human rights activists, investigative journalists, and advocates have likened cobalt mining in the DRC to old-world slavery due to the abuses that have gone unpunished. Here are some of the documented cases:- Tunnels are dug by hand and not secured with beams or other forms of support, sometimes causing them to collapse and bury Congolese miners alive.
- Miners are not provided with any safety gear or machinery.
- In 2016, the provincial governor of Kolwezi confirmed that children worked in the cobalt mines but that the government was “too poor” to address the issue.
- In November 2016, Republican Guard soldiers set fire to houses in the Mukumbi settlement to make way for mining expansion and assaulted individuals who tried to stop them.
- Militias reportedly abduct children from other regions and force them to work in the mines.
- At least 65 deaths were recorded in six mining sites between January 2019 to May 2023.
- In 2023, The Washington Post reported that operators of heavy machinery work 12-hour shifts — with only one break per day — six days in a row, causing long-term spine and back problems.
Doing Better: Recommendations for Combating Modern Slavery
Modern slavery is an evil that we must address. The data review shows that it is a pervasive problem that only seems to worsen with time. Here are a few critical efforts we could make on personal, national, and international levels.Increased Global Awareness
We have to give credit where it is due — many organizations are currently working to sound the alarm on modern slavery. These include UN organizations, government agencies, and privately-run advocacy groups. Many of them even collaborate with each other, sharing knowledge and data to improve their efficiency. However, despite these efforts, the issue of modern slavery is not yet in the mainstream discourse. Most people will probably be surprised to know that there are more enslaved people now than at any other point in history. Perhaps even more shocking: many of these enslaved people are exploited in high-income countries. Public participation is a crucial component of any successful advocacy effort, and the lack of public awareness regarding the magnitude of modern slavery hinders this participation. Awareness is crucial for advocacy and increases public vigilance. A population that understands modern slavery and how to spot it becomes an effective ally to law enforcement. People need to know what to look out for and which agencies to report suspicious activity to.Remove Modern Slavery From Global Supply Chains
Almost all forms of slavery are driven by profits. This is why privately-imposed forced labor far exceeds state-imposed slavery. It is also why criminals traffic modern-day slaves from vulnerable communities to high-income countries. Slave labor is about maximizing profits by reducing the operational costs of a voluntary labor force. Criminals will continue to enslave people as long as there is a demand for forced labor, so any effective anti-slavery action plan must address this demand. Companies must be held accountable if they benefit from slave labor — even if it is through their subsidiaries, partners, or suppliers. It also helps when people stop supporting companies and brands whose supply chains involve forced slave labor.