

Monitoring your website used to be a complicated matter, but not anymore. These days, there are quite a few easy-to-use website monitoring tools that make the process simple and accessible. Some of these tools are even free, which is great news for small businesses or individuals that are just getting started.
As with any type of free service, it can be hard to know which ones you can really rely on – and choosing your website monitoring tool is a particularly critical decision. You don’t want to risk losing leads, customers, and revenue because of a poor quality monitoring service.
To help you make the best choice, I tested dozens of services and narrowed them down to the top 15. The top tools on my list stood out for their uptime accuracy, real-time alerts, ease of use, detailed reporting, and extra features like multi-location checks and SSL monitoring. This list includes five of the best free monitoring tools, plus ten paid options designed for businesses with more complex requirements. Read on to find the best monitoring tool for you.
Short on Time? These Are the Best Web Monitoring Tools in 2026
Free Web Monitoring Tools
- UptimeRobot. One of the most generous free tools on the market – it can perform uptime checks every 5 minutes.
- StatusCake. A great, beginner-friendly option that includes speed tests and domain monitoring.
- Jetpack. Free basic monitoring for your WordPress site; it even includes some additional security features.
Paid Web Monitoring Tools
- Pingdom. Intuitive and comprehensive monitoring tool that covers every data point you might need.
- Uptimia. Straightforward monitoring that doesn’t skimp on features, despite its budget-friendly price.
- Uptrends. Monitors your website’s performance from 230+ locations and includes false alarm protection.
What Are Website Monitoring Tools?
These tools are exactly what they sound like – website monitoring tools are applications that automatically check the health and performance of your website. They do this by continuously connecting to your website at set intervals. Then, they run a series of tests. These can cover simple uptime monitoring to more complex tests that simulate how a real user would interact with your site.
Website monitoring tools typically come in three forms:
- Browser-based. The most common type. We’ll be focusing on these today as they’re the easiest of the three to use – all you need to do is connect your website to the tool, and it will start monitoring straight away. They’re simple to use, but still include plenty of features.
- Server-based. These monitoring tools are installed directly onto your web server. In addition to website performance, they can also track how efficiently your server is running.
- Self-hosted. These are a little more technical, as you’ll usually have to install and configure them for your own server or local machine. However, they let you monitor your website without having to rely on external servers or the cloud.
Types of Website Monitoring
You’ve likely come across simple tools or plugins that offer basic “is my website up” tests, but there’s so much more that the best monitoring tools cover. Here’s a quick summary of the different types of website monitoring tests you may come across:
- Uptime/downtime. Uptime/downtime monitoring tests site availability by pinging it from multiple global locations. It will also log how long your site stays down during outages.
- Real User Monitoring (RUM). Tracks real user experiences on your website by logging clicks, navigation flows, and visit outcomes. Some tools even record some of these visits, so you can see exactly what your visitors experience.
- Synthetic monitoring. Simulates user interactions in a controlled environment. Useful for spotting broken links or unoptimized elements before users do.
- Security monitoring. Scans for intrusion and malware, poor firewall configurations, expired Secure Socket Layer (SSL) certificates, and other security risks.
- Transaction monitoring. Tests whether your checkout or booking flows are working properly – essential for e-commerce sites.
- API monitoring. Checks that your website’s API connections (like product or payment systems) are working as expected.
- Analytics monitoring. Tracks how users arrive at your site, where they go, and what actions they take.
- Error monitoring. Logs error messages and site malfunctions. Some tools let you forward this info directly to your IT team.
- Infrastructure monitoring. Keeps tabs on the hardware and software that power your website to ensure everything is running smoothly.
- Application performance monitoring (APM). Checks that specific web applications (like contact forms or booking systems) are working properly.
Critical Website Monitoring Metrics
There are hundreds of data points that web monitoring tools capture, and browsing through your dashboards might look overwhelming at first. So, to keep things simple while you learn your way around, these are the core metrics to pay attention to:
- Uptime percentage. Tracks how long your site stays accessible to visitors.
- Page load speed. Measures how quickly your pages load for visitors in different parts of the world.
- Error rate. Logs how frequently users encounter errors like broken links or missing files.
- Server response time. Shows how fast your server reacts to visitor requests.
- Bounce rate. Measures how many users leave after viewing just one page. A high rate can signal poor load times or usability issues.
- SSL certificate status. Ensures your SSL certificate remains valid and active. Without a valid SSL certificate, browsers may warn visitors that your site is insecure.
- Bandwidth usage. Tracks how much bandwidth your site needs, which is helpful if your hosting provider has a bandwidth cap.
- Geographic response times. Shows whether your site performs differently in certain regions. Poor performance may point to server issues.
- Resource utilization. Tracks how much processing power, memory, and storage your site is using.
Choosing the Best Website Monitoring Tool for Your Business
Not every web monitoring tool will be a good fit for your business. Some tools may be too basic, while others will include features your business doesn’t need. If you’re not sure what to look for in these tools, here are some helpful pointers:
- Ease of use. Most tools track a lot of data, often with graphs and charts that show changes over time. But these visuals aren’t always easy to read or interpret. If you’re going to be using these tools yourself, consider what your current level of technical knowledge is and how you’d like the data to be presented.
- Monitoring types. As covered above, these tools can monitor several different areas of your site. It’s certainly great to see everything, but it might not be necessary for your business. Make a list of the kinds of monitoring that are vital for you, so you don’t end up paying for features that won’t help your site.
- Alerts. Monitoring tools will typically alert you if something goes wrong, like if your website has gone offline or you’ve got a spike in errors. These alerts are usually sent via email, but some tools offer SMS, voice call, or integrations with apps like Slack. Choose tools that send alerts in ways that fit into your daily workflow.
- Pricing. A key factor is how much you have in your budget for web monitoring. While there are free tools out there, these are often limited to uptime monitoring only. Keep in mind that monitoring tools with more features are usually more costly.
Best Free Web Monitoring Tools
1. UptimeRobot: Generous Free Plan for Basic Monitoring
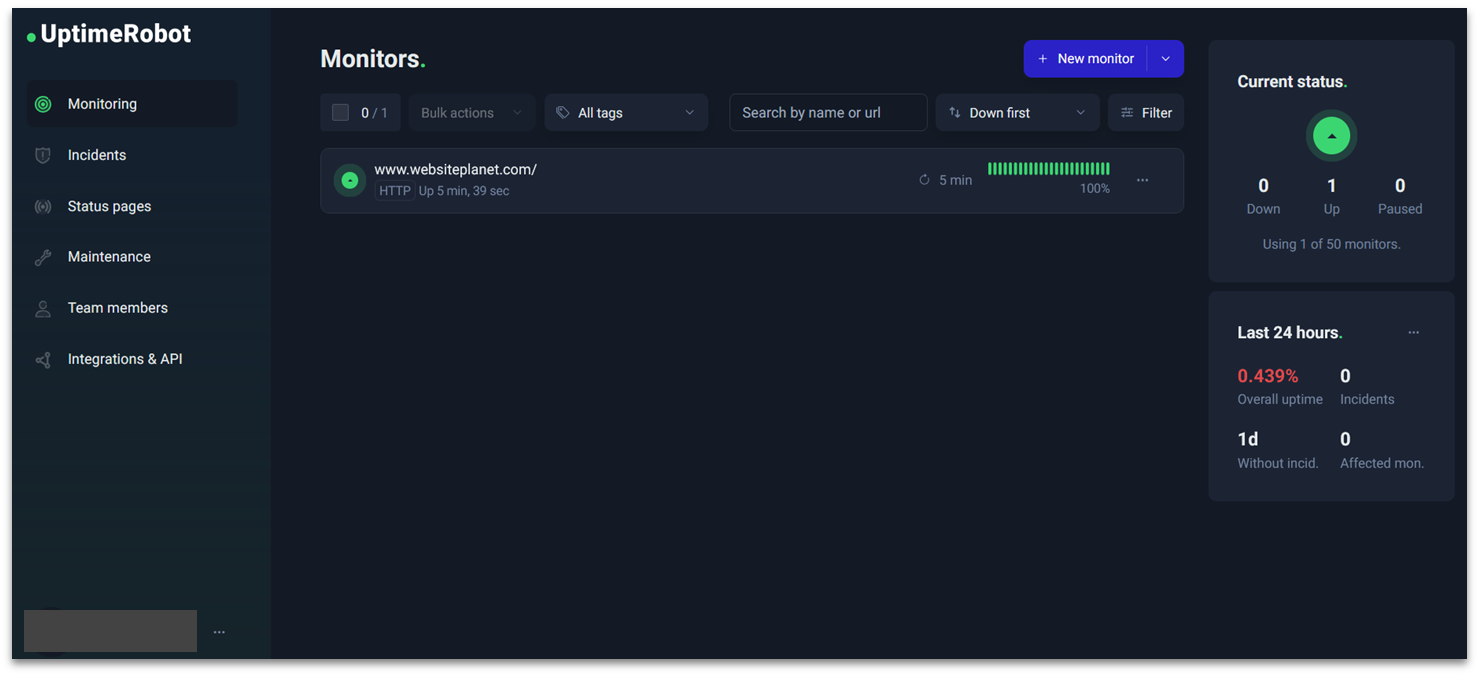
UptimeRobot offers one of the most generous free plans on the market. You get simple uptime/downtime monitoring for up to 50 websites or pages before you need to upgrade. The checks are performed from an automatically chosen location across 4 regions (North America, Europe, Asia Pacific, and Australia). It even includes response time statistics for basic page load performance monitoring.
Your website receives automatic health checks every 5 minutes, giving you peace of mind around the clock. When any issues are detected, you’ll receive immediate downtime alerts, helping you respond quickly to any problems.
That said, the free plan is still limited – you don’t get any advanced monitoring types like RUM. For more comprehensive coverage, paid plans start at just $18/month for 50 monitors. This includes expanded features like SMS alerts, voice calls, 12 months of log retention, and the ability to select monitoring locations.
Features:
- Multiple alert channels. Choose to alert your team to downtime via email, SMS, or voice call. The only downside is that, on the free plan, you have to purchase credits to get SMS or voice call alerts.
- Third-party integrations. Connect UptimeRobot with popular platforms like Discord and Google Chat so your team can be alerted of downtime wherever they’re working.
- Mobile app. Monitor your site’s health from outside the office with UptimeRobot’s Android and iOS app.
| Monitoring types (on free plan) | Uptime/downtime, response time |
|---|---|
| Complexity | Low |
| Free premium trial? | ✘ |
| Starting price | $0 |
2. StatusCake: Beginner-Friendly, Feature-Packed Monitoring
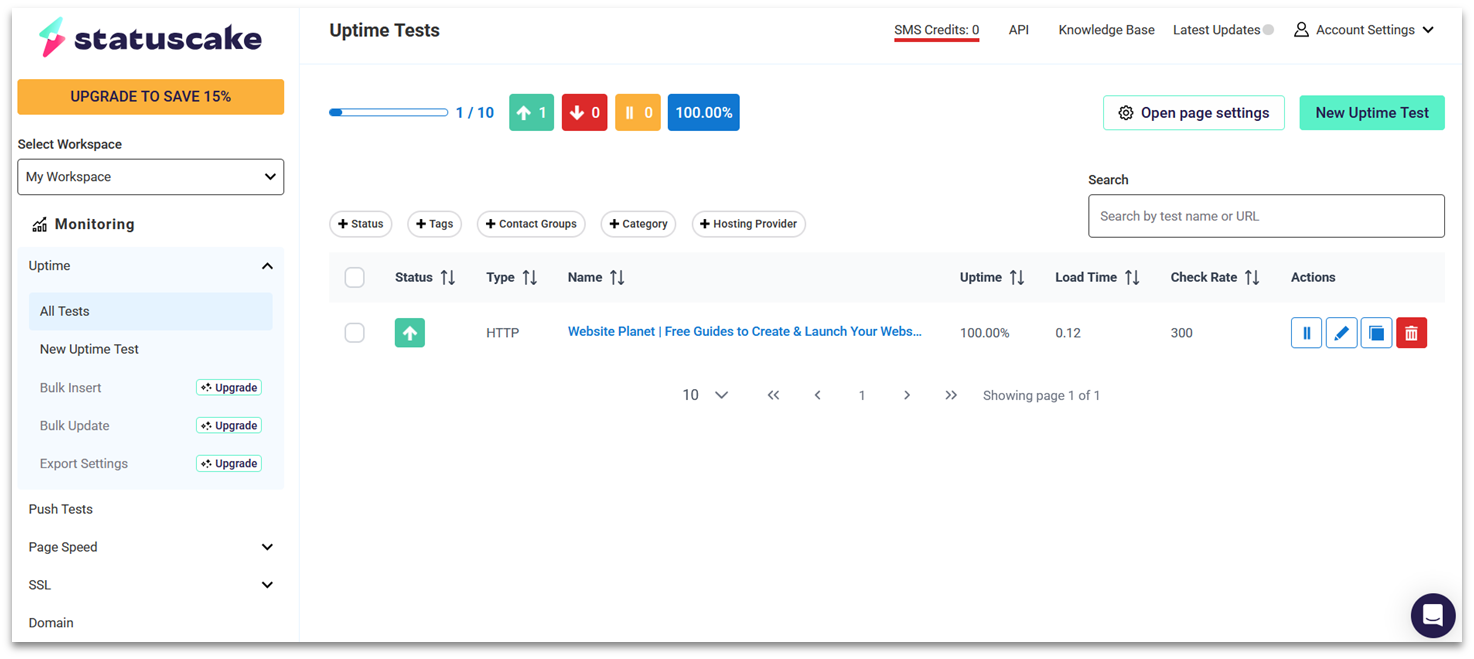
StatusCake sets itself apart with city-level testing regions across 30 countries, giving you more precise control over where your website monitoring occurs. While free plan users are limited to a default testing location, you can enable confirmation servers to double-check any detected downtime, minimizing the risk of false alerts.
The platform offers comprehensive page speed monitoring at no cost, allowing you to track your website’s performance and identify potential bottlenecks. You can analyze load times for individual pages and monitor changes over time. Like with uptime monitoring, you’re limited to using a default testing location.
For more advanced monitoring capabilities, you can get a 7-day free trial of its premium plans that start at $12.49/month. This unlocks valuable features like SSL certificate validation and the ability to set up 100 monitors. You’ll also get access to custom status pages and more frequent monitoring intervals.
Features:
- Slick interface. The platform features a clean, intuitive dashboard that makes it easy to monitor your websites at a glance. Color-coded status indicators instantly show you the health of your monitored sites.
- 3 monitors. You can run up to 3 uptime tests and 1 speed test on the free plan. It’s more limited than UptimeRobot, but it’s still enough to cover a personal website or small business.
- Customer support. If you run into any issues, you can contact human support through live chat or email.
| Monitoring types (on free plan) | Uptime/downtime, page speed |
|---|---|
| Complexity | Low |
| Free premium trial? | Yes, 7 days |
| Starting price | $0 |
3. Jetpack for WordPress: Free Uptime Monitoring With One-Click Installation
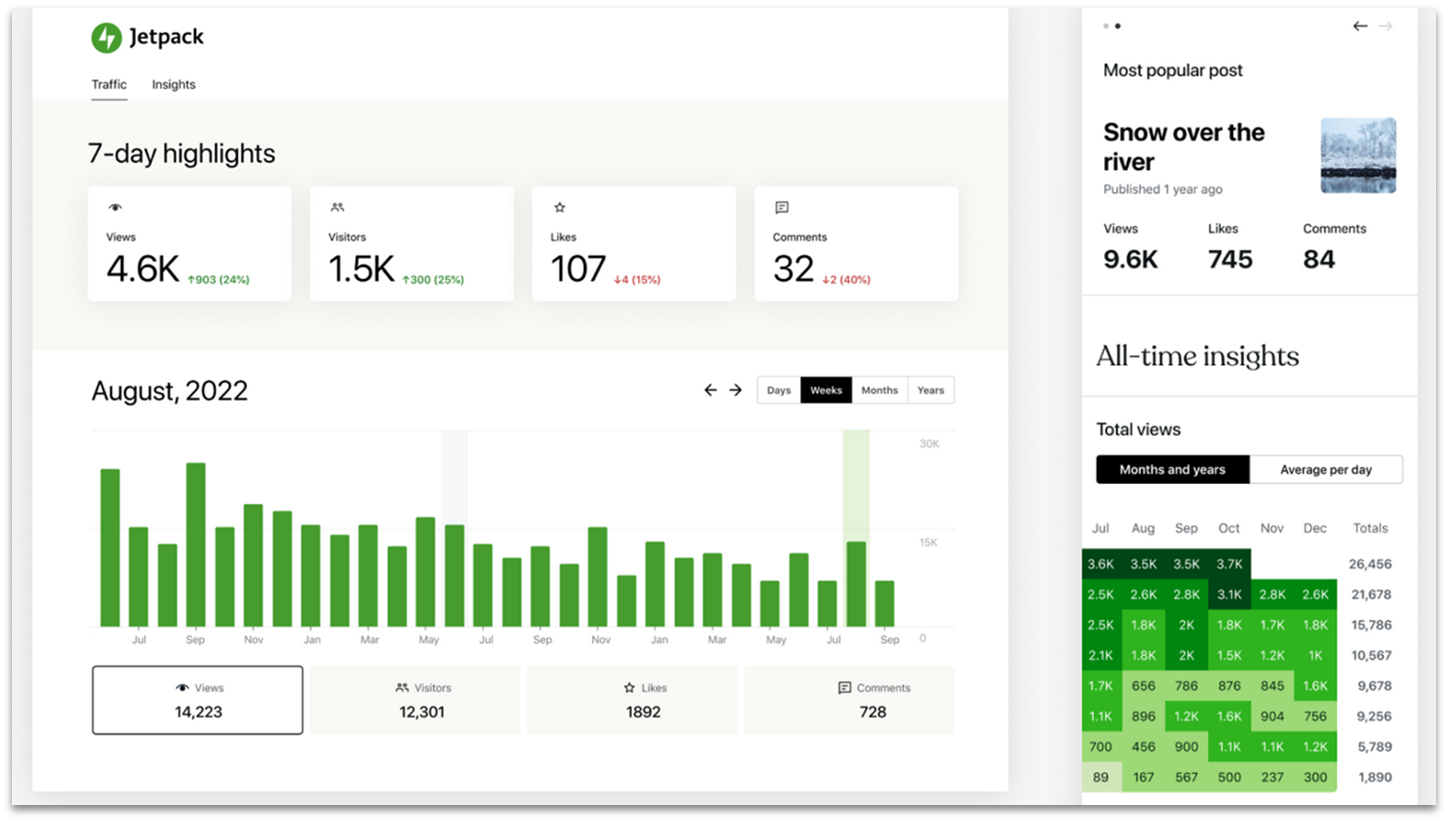
Jetpack provides a versatile monitoring solution for WordPress, seamlessly integrating with both hosted WordPress.com sites and self-hosted WordPress.org installations. If you’re already familiar with WordPress, you’ll find Jetpack’s interface intuitive and its setup process straightforward, making it an excellent choice for beginners and experienced users alike.
The free plan offers impressive value for personal and non-commercial websites. You’ll get essential site uptime/downtime monitoring as well as metrics like visitor numbers and views on specific pages. You even get some basic brute force attack protection and content blocks for your site, so it’s an essential all-in-one free tool.
Premium plans provide advanced uptime monitoring with instant notifications, detailed performance tracking, and comprehensive security monitoring. These plans also include automated real-time backups which are performed whenever your site is updated, making it easy to quickly rollback to a previous version if issues arise.
Features:
- Downtime alerts. Jetpack sends email notifications to all associated WordPress users if your site goes down. If you use WordPress.com and have its app installed, then you can also get push notifications on Android or iOS.
- Site accelerator. If you’ve got a problem with page load time, Jetpack can help. The free version of the plugin includes an image optimization tool that can speed up your site.
- Budget-friendly. Jetpack starts at only $10 a month for security or statistics monitoring. Features are available as bundles or individual packages, so you don’t need to pay for features you won’t use.
| Monitoring types (on free plan) | Uptime/downtime, basic security, analytics |
|---|---|
| Complexity | Low |
| Free premium trial? | ✘ |
| Starting price | $0 |
4. Montastic: No-Frills Website Monitoring for Free
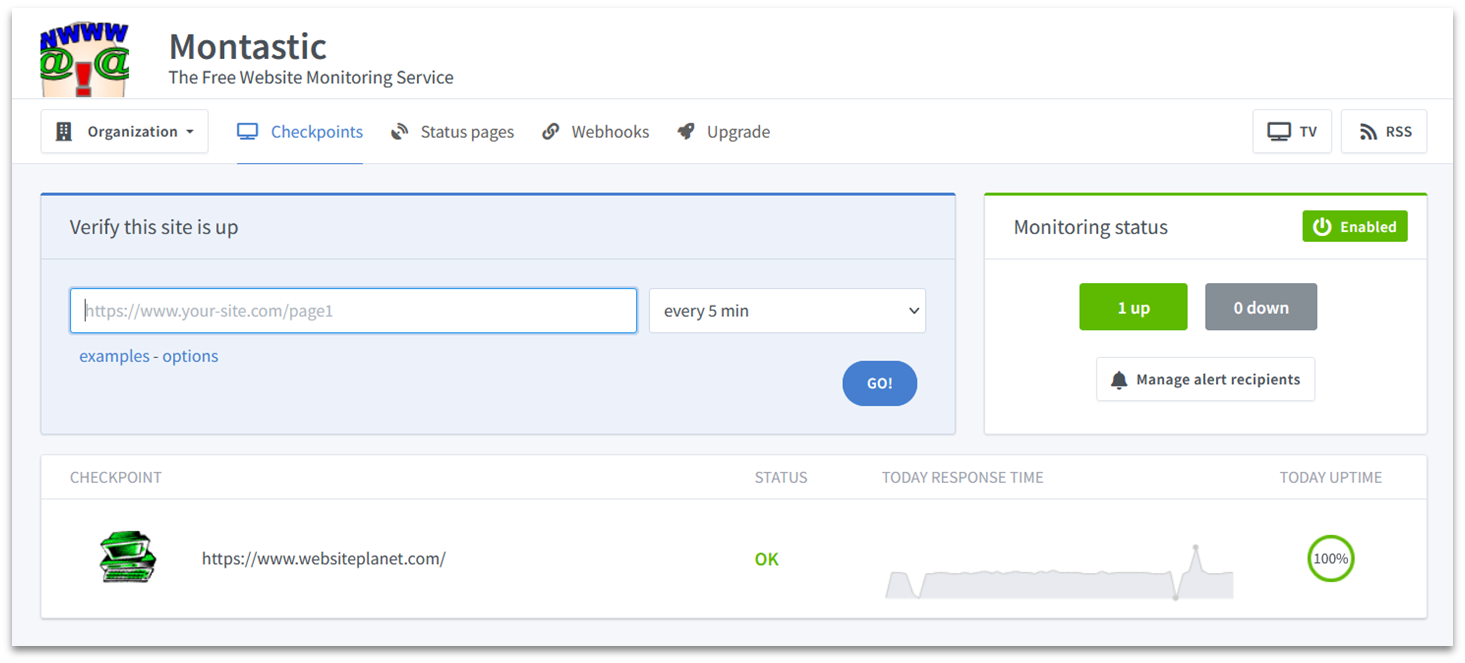
Montastic delivers straightforward website monitoring without anything fancy. You get free uptime checks every 5 minutes for up to 50 pages or websites. The dashboard is extremely simplistic, and it doesn’t have any built-in pressure to upgrade like the other free options I’ve covered.
The Team plan starts at just $5/month and introduces enhanced capabilities like response time monitoring and support for larger teams. However, if you’re monitoring an open-source web app, you can get the Business plan for free. This includes support for even more team members and free SMS credits.
The only issue I have with Montastic is that it doesn’t support any advanced monitoring at any pricing tier. So, while it’s a great option for basic monitoring for simple websites, it might not provide enough for you if you need security, performance, or transaction monitoring.
Features:
- Google integration. If you want to get started quickly, simply sign up with your Google account. This way, you don’t have to remember any extra passwords.
- Keyword monitoring. The free plan includes some basic keyword monitoring, which simply checks your page’s HTML code to see if certain keywords are (or aren’t) present.
- Email alerts. When your website experiences downtime, Montastic can notify up to 20 team members via email alerts on the free plan.
| Monitoring types (on free plan) | Uptime/downtime |
|---|---|
| Complexity | Low |
| Free premium trial? | ✘ |
| Starting price | $0 |
5. Site24x7: Highly Scalable Web Monitoring Solution
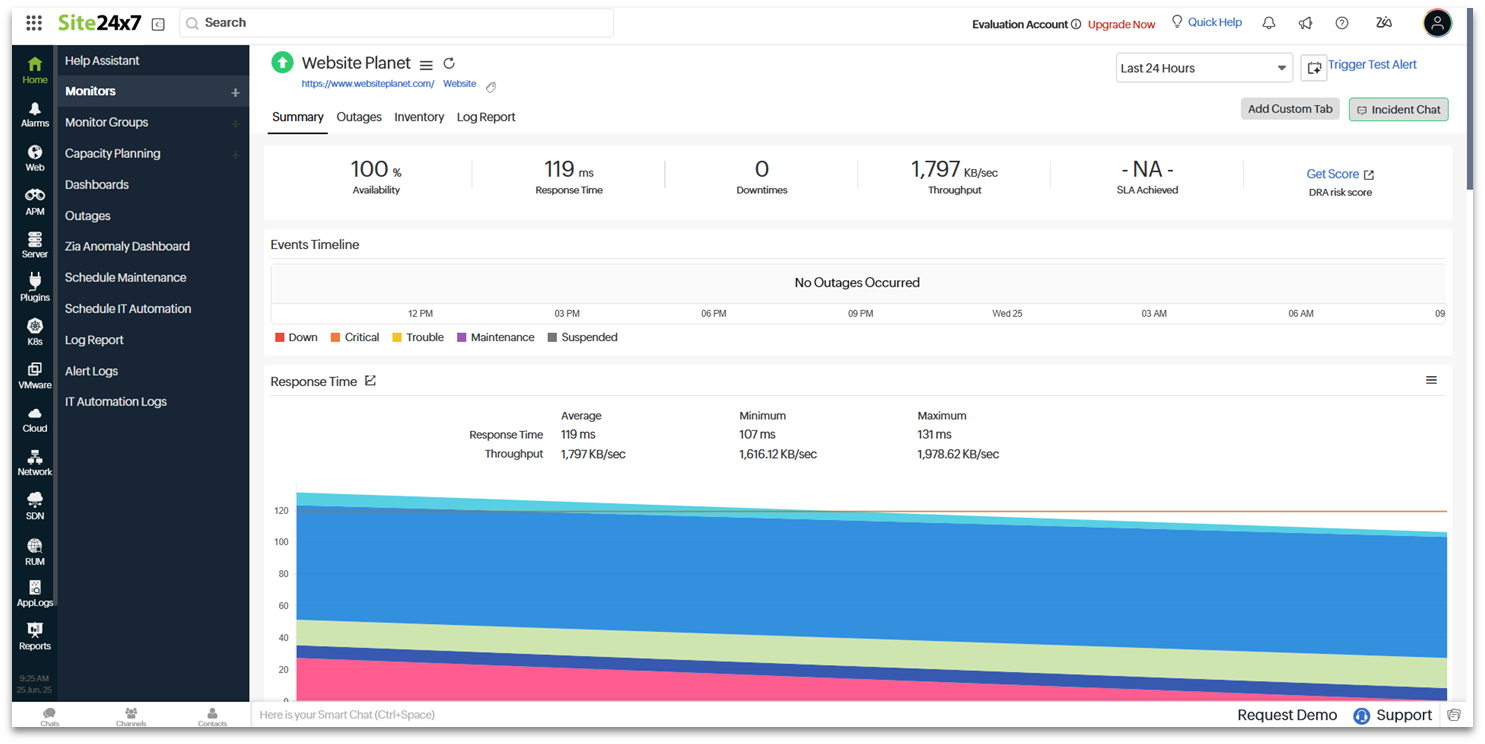
Beyond basic website monitoring, Site24x7’s premium features cover your entire digital infrastructure. You can get detailed insights into cloud services, network performance, server infrastructure, and virtual machine health on any paid plan.
Site24x7 offers a 30-day free trial of its premium plan, which downgrades into a limited free-forever plan that provides basic uptime monitoring with downtime alerts for 5 websites. Despite this basic free plan, it’s not the best choice for beginners. The interface is designed with IT professionals in mind.
Its premium plans start at $9/month for website monitoring. This includes 25 monitors with testing intervals as frequent as every minute, conducted from over 130 global locations.
Features:
- Customizable alert management. You can set designated user groups to receive alerts. You can even create an on-call schedule so that, if an alert is sent, it only goes to employees who are marked as available.
- API and APM monitoring. These are super useful to have if you need to monitor your web applications or connections to your databases.
- Color-coded monitors. The dashboard uses an intuitive color-coding system to show the health of each monitor at a glance. It’s easy to immediately spot and prioritize critical issues without digging through logs.
| Monitoring types (on free plan) | Uptime/downtime |
|---|---|
| Complexity | High |
| Free premium trial? | Yes, 30 days |
| Starting price | $0 |
Best Paid Web Monitoring Tools
1. Pingdom: Affordable Comprehensive Monitoring Tool
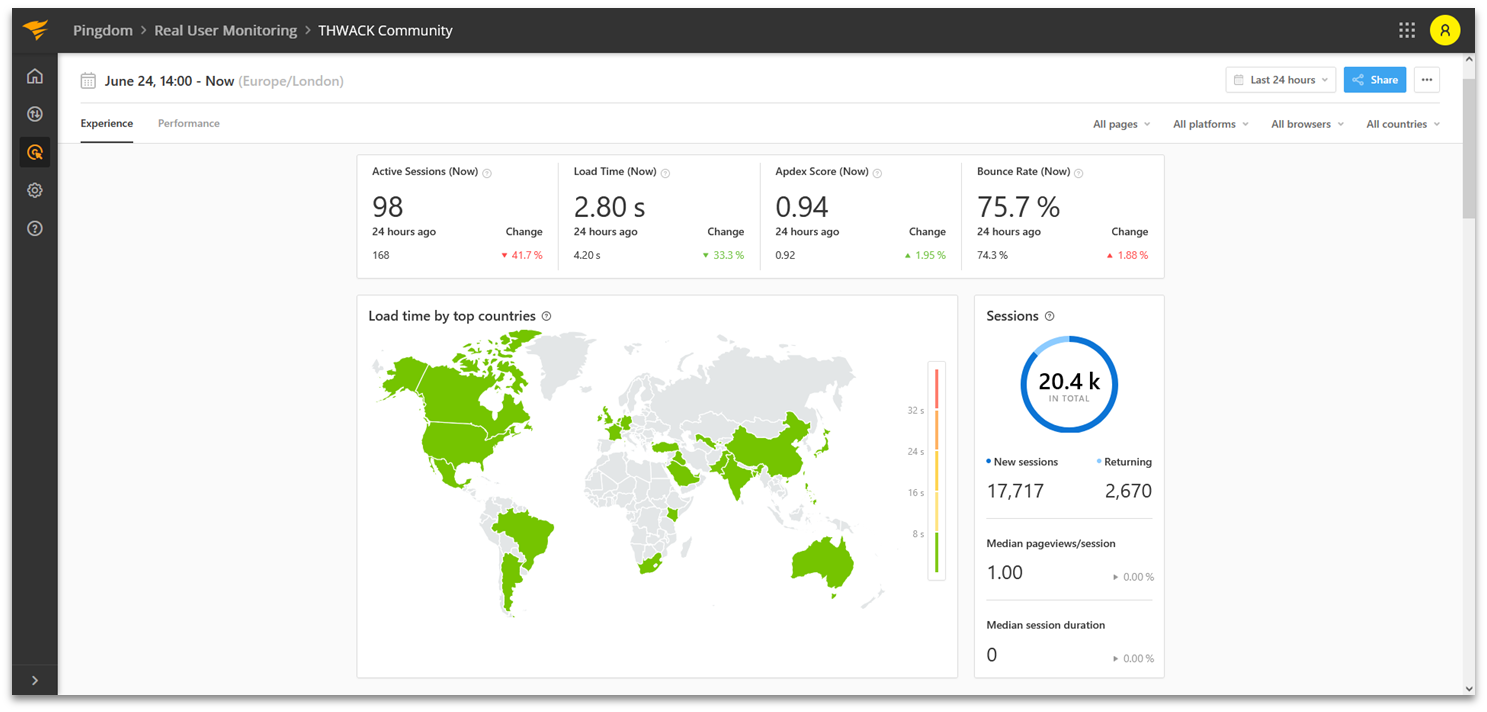
Pingdom provides an extensive array of monitoring capabilities. From basic uptime tracking to sophisticated Real User Monitoring (RUM), you’ll receive detailed reports and analytics that help identify potential issues before they impact your users. The comprehensive dashboard presents clear metrics on everything from page load times to transactions.
Pingdom’s powerful feature set might seem complex at first glance, but the interface includes helpful guidance throughout, with convenient help icons placed next to each metric and data point. Simply hover over them for clear explanations about what each measurement means and why it matters for your website’s performance.
You can choose either synthetic monitoring or RUM for as little as $10/month. You can combine these services to create a complete monitoring solution, and choosing annual billing saves you 20% on your subscription. This flexible pricing structure means you only pay for the specific monitoring tools you need.
Features:
- Transaction monitoring. You can set up automated transaction testing by writing your own scripts or, if you’re less tech savvy, by recording each click you want to measure.
- Global monitoring. Pingdom offers servers across 4 regions (North America, Europe, Asia Pacific, and South America). Whenever you run a test, the tool picks 10 servers in various locations across your chosen region and takes an average result.
- Regular testing. This web monitoring tool will probe your website every minute, so you’ll get early notifications if anything goes wrong. You can even set a threshold for downtime, after which your team will receive alerts.
| Monitoring types | Uptime/downtime, site speed, transaction, RUM, analytics |
|---|---|
| Complexity | Medium |
| Free premium trial? | Yes, 30 days |
| Starting price | $10/month |
2. Uptimia: Straightforward Premium Monitoring for Small Businesses
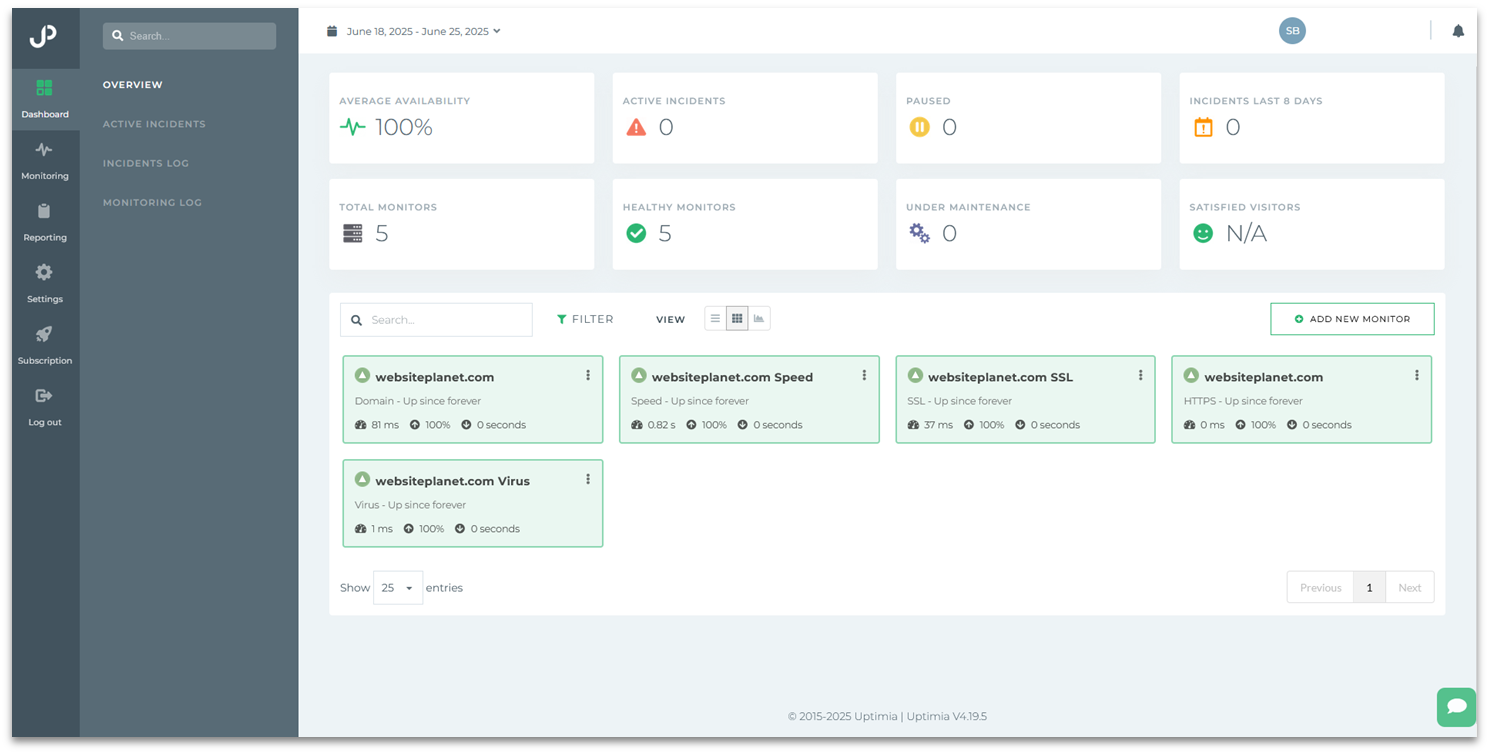
Uptimia’s intuitive platform provides everything you need without the clutter. When you sign up, the system automatically configures essential monitoring tools for your website, including uptime checks from over 170 global locations, page speed measurements, SSL certificate validation, and malware scanning.
While it’s simple to use, it may lack some customization options found in more complex tools. That said, I particularly liked the comprehensive incident tracking system, which provides detailed information about any issues affecting your website. When problems occur, you can see exactly how long they’ve been happening and what might be causing them.
Starting at just $9/month, you get 10 uptime monitors that check your site every minute, along with page speed monitoring and transaction monitoring capabilities. You can try all these features risk-free with a 30-day trial that doesn’t require a credit card.
Features:
- Welcome tour. The platform guides you through all features and explains key metrics in simple terms when you sign in for the first time.
- Custom reports. You can create custom reports with your own branding and logo, perfect for agencies and client presentations.
- Automated reporting. Uptimia sets up a daily, weekly, monthly, and yearly reporting schedule automatically, and you can add more reports if needed.
| Monitoring types | Uptime/downtime, site speed, transaction, RUM, security |
|---|---|
| Complexity | Medium |
| Free premium trial? | Yes, 30 days |
| Starting price | $9/month |
3. Uptrends: Comprehensive Monitoring for Larger Businesses
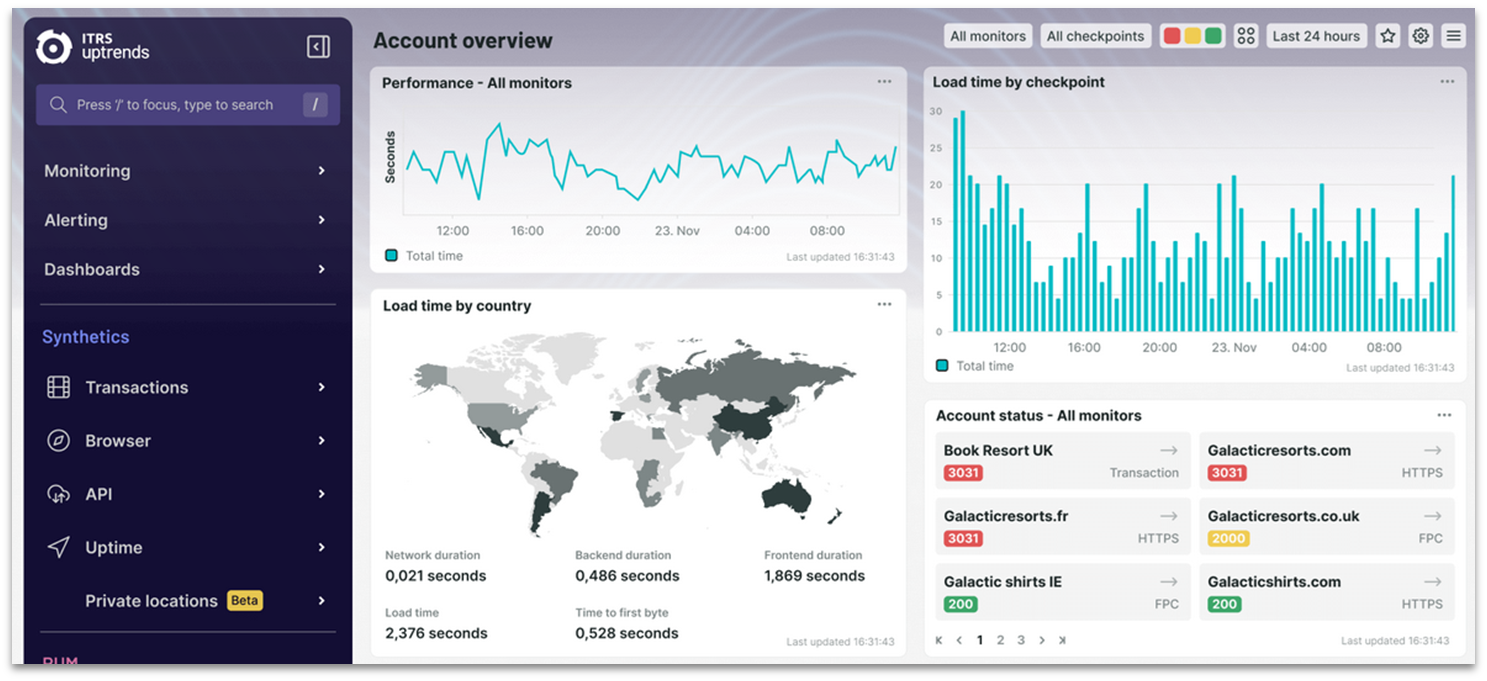
Uptrends provides real browser testing across major browsers, full page checks from over 230 global checkpoints, and transaction monitoring to track your website’s shopping processes and functionalities.
Its colorful dashboard also makes it easy to see how your website’s performing. Even though Uptrends offers tons of data points to track, it never once felt overwhelming or too hard to grasp.
Pricing depends on the types of monitoring you need, and you can combine them to build a comprehensive package. Basic uptime monitoring starts from $5.10/month per credit, and you can add extra tests like RUM for around $9/month. While this flexible pricing lets you customize your plan, smaller businesses might find it a bit expensive at the lower tiers.
Features:
- Private checkpoints. If your website uses internal applications to function, this lets you test them from behind your firewall.
- Transaction recorder. You’ll get a detailed analysis of your website’s processes and load times through a standard user flow.
- False alarm protection. Uptrends uses dual-checkpoint verification to prevent false alarms. You can also specify when you’re running maintenance so your team isn’t swamped with alerts.
| Monitoring types | Uptime/downtime, site speed, transaction, API, RUM |
|---|---|
| Complexity | Medium |
| Free premium trial? | Yes, 30 days |
| Starting price | $5.10/month |
4. HostTracker: Huge List of Global Monitoring Locations
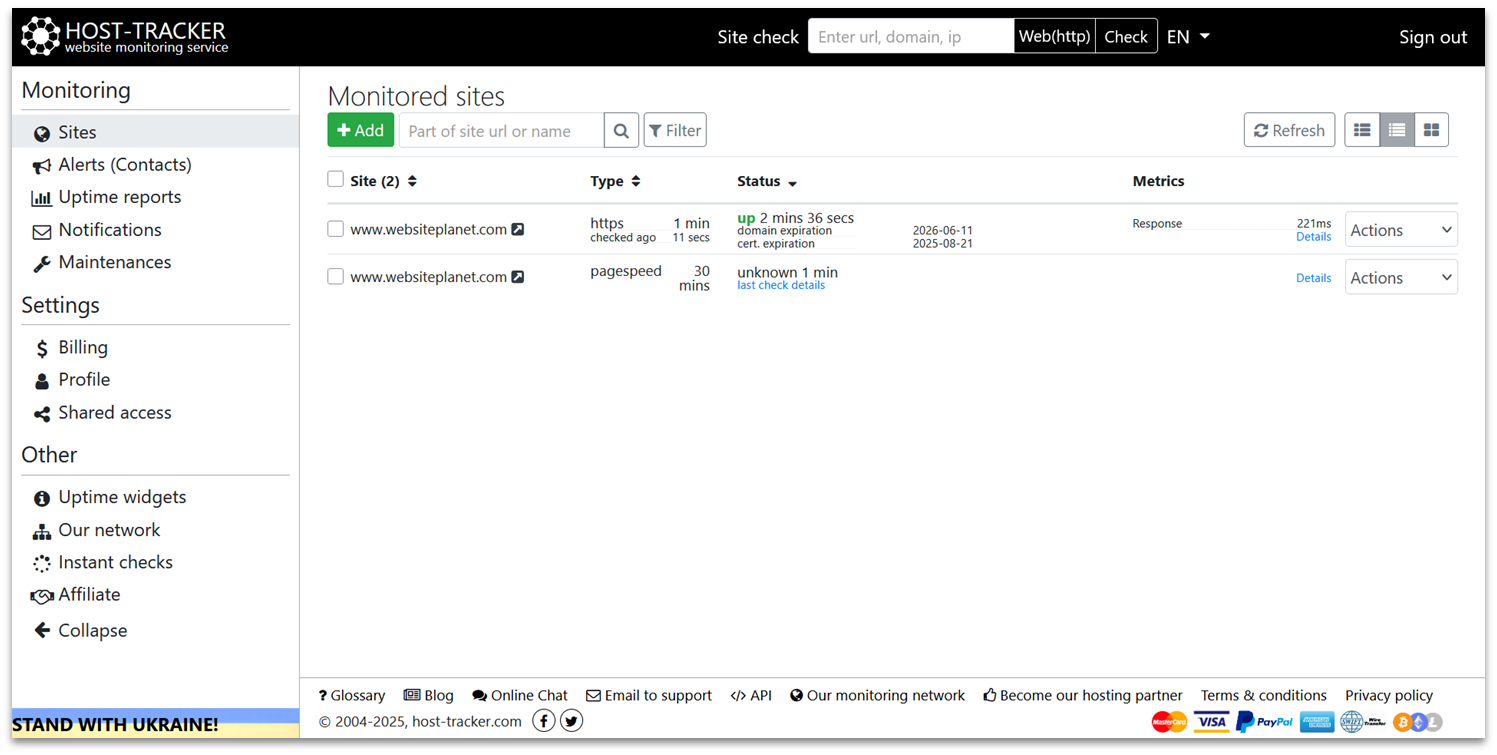
HostTracker delivers comprehensive website monitoring from 300+ locations. From uptime monitoring to performance tracking across hundreds of global locations, you can easily spot and diagnose issues before they impact your business.
While the functionality is robust, the user interface feels somewhat dated compared to modern monitoring tools, despite a recent redesign. However, this simplicity does make it easier to navigate and find critical information quickly.
Plans start at under $10/month, ideal for smaller websites needing professional-grade oversight. This plan monitors up to 10 URLs every 5 minutes, includes essential security checks, and delivers comprehensive health reports to keep your sites running smoothly.
Features:
- Contact list. HostTracker lets you set up a list of users to receive alerts. You can customize who receives which alerts and if alerts are delayed.
- Several alert channels. Send alerts to your team via email, SMS, voice call, Facebook, Discord, and web browser notifications.
- Scheduled maintenance. You can create a planned maintenance schedule to prevent alerts while your website is intentionally down.
| Monitoring types | Uptime/downtime, site speed, transaction, API |
|---|---|
| Complexity | Medium |
| Free premium trial? | Yes, 30 days |
| Starting price | $9.90/month |
5. Datadog: Premium Real-Time Monitoring With Plenty of Visuals
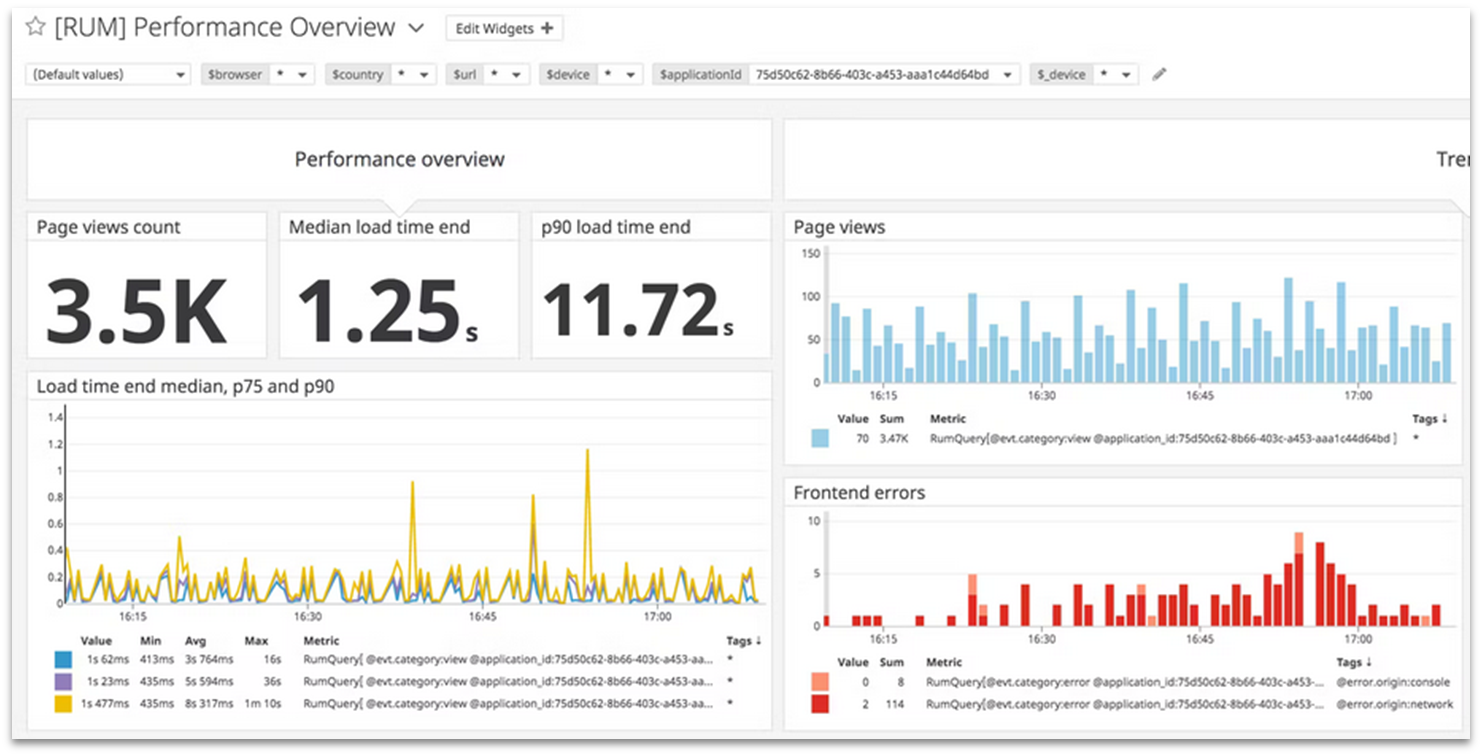
Datadog offers comprehensive oversight across numerous data points in real time. The platform is particularly well-suited for organizations whose revenue heavily depends upon web assets. Its sophisticated monitoring capabilities help prevent costly downtime by letting you quickly address potential issues.
That said, I found Datadog a bit tricky to get started with. It’s a highly complex tool with a ton of technical jargon, which makes sense given that it’s designed for software developers, DevOps professionals, and IT teams.
Starting with a free trial, you can explore Datadog’s core metrics and functionality without commitment. The Browser Testing plan, priced at $12/month per thousand test runs, offers a great level of website monitoring without an excessive price. For additional insights, you can add RUM at $0.15/month per thousand sessions.
Features:
- Flexible pricing. You can pay for each monitoring type when you start to need it, and you don’t always need to commit to a monthly subscription. You can pay for some tools as you use them, so you can try them out without a massive financial commitment.
- Sales demos. If you’re not sure if Datadog will work for you, you can request a demo from the sales team first.
- Smart alerts. While you can set up alerts manually, Datadog offers a machine-learning-powered alerts system that will automatically detect anomalies.
| Monitoring types | Uptime/downtime, site speed, transaction, RUM, infrastructure, APM, API, and more |
|---|---|
| Complexity | High |
| Free premium trial? | Yes, 14 days |
| Starting price | $12/month |
Other Notable Web Monitoring Tools
If none of the above tools work for you, don’t worry! I took a look at dozens of web monitoring tools during my research, and these are the other ones that stood out:
6. New Relic
New Relic is also designed for IT professionals and other technical teams, so it’s a better choice for businesses on a larger scale. Like Datadog, it offers a ton of different monitoring types, like RUM and performance analytics. However, it’s another tool that might be too complex if you’ve never used web monitoring tools before.
7. LogicMonitor
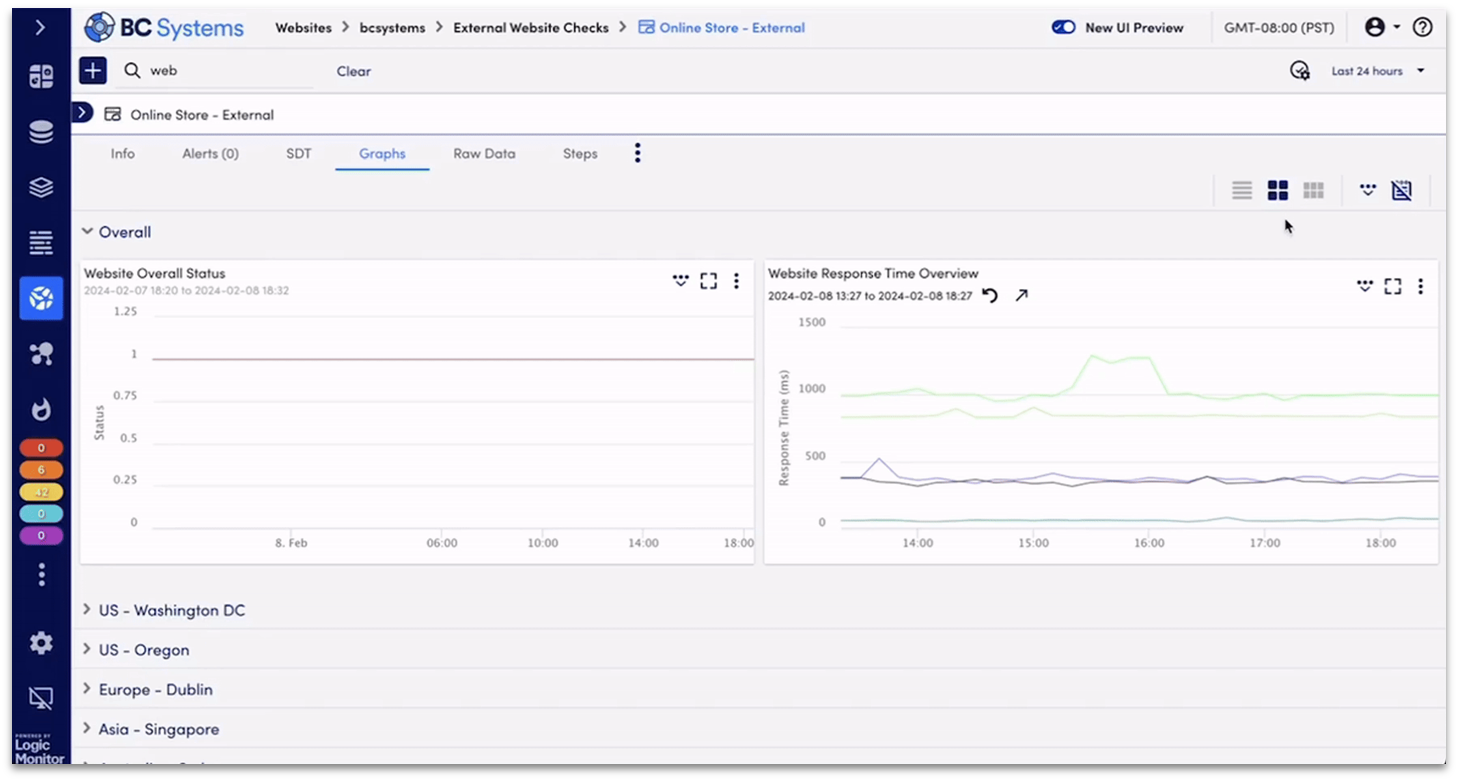
Like Datadog and New Relic, LogicMonitor was designed for infrastructure monitoring. However, it offers powerful website monitoring capabilities through synthetic testing. You’ll get uptime monitoring, analytics, and smart alerts. It offers a free trial, but synthetic testing is considered an add-on to infrastructure monitoring, so it could be costly.
8. Dynatrace
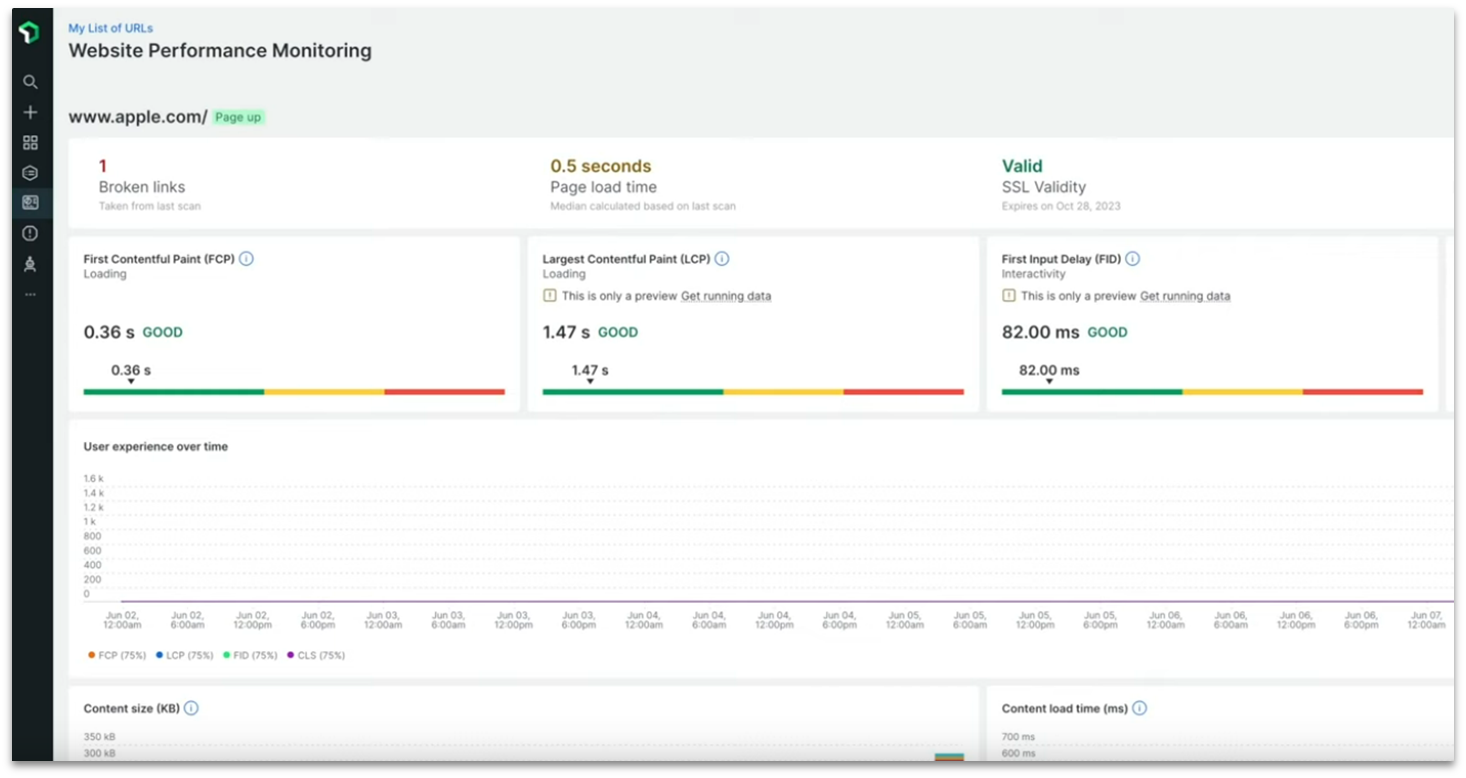
Dynatrace is one of the few tools I found that tracks your website’s Core Web Vitals, which is a universal way of defining your website’s performance. It also offers error overviews that contextualize the impact of issues on users. The only reason it’s so low is that, if you just want these digital experience tools, you’ll have to pay as you go, which makes it difficult to budget.
9. Sentry
Sentry offers full-stack web monitoring, so you can see how the changes you make to your website are affecting users. Plus, it’s the only tool on this list that provides a user feedback code snippet, which allows your customers to report bugs. The only issue is that it’s a very code-heavy tool, so you’ll need some web development knowledge to use it effectively.
10. ThousandEyes
ThousandEyes is another tool that was designed for industry use, but has since expanded into web monitoring. Unsurprisingly for a Cisco product, it focuses on examining the health of your network and infrastructure to determine how your website’s performing. Because of that, it might not be the best choice if you don’t have control over where your site is hosted.
Quickly Compare Our Recommended Web Monitoring Tools
Phew, that was a lot to get through! If you’re struggling to pick out a favorite, here’s a quick comparison of the top 10 website monitoring tools:
| Best Feature | Monitoring Locations |
Free Trial? | Monthly Cost | |
|---|---|---|---|---|
| Uptime Robot | Free plan provides 50 uptime and response time monitors | 4 | Free forever plan | $0–$648 |
| StatusCake | Free speed and uptime monitoring with a beginner-friendly interface | 28 | Free forever plan, 7-day free trial | $0–$69 |
| Jetpack for WordPress | Basic uptime monitoring with one-click WordPress installation | Unknown | Free forever plan | $0–$24.95 |
| Montastic | No-frills uptime monitoring with no upsell pressure | Unknown | Free forever plan | $0–$49 |
| Site24x7 | Highly scalable solution that covers more than just websites | 130 | Free forever plan, 30-day free trial | $0–$449 |
| Pingdom | Affordable website monitoring with in-depth insights | 100+ | 30-day free trial | $10–$18,300+ |
| Uptimia | Intuitive and comprehensive monitoring that’s great for beginners | 170+ | 30-day free trial | $9–$199 |
| Uptrends | Tons of actionable insights for larger businesses | 230+ | 30-day free trial | $5.10–$50.57 |
| HostTracker | 300+ global monitoring locations with an easy-to-read dashboard | 300+ | 30-day free trial | $9.90–$75 |
| Datadog | Comprehensive oversight over thousands of data points | Unknown | 14-day free trial | $12+, including pay-as-you-go options |
Website Monitoring Best Practices
To help you maximize the effectiveness of your website monitoring efforts, I’ve compiled a list of essential best practices based on our collective experience. These guidelines will help you implement a robust monitoring strategy and get the most value out of your chosen tools.
- Define clear objectives. Note down what you and your team are trying to achieve, as well as the types of monitoring that could help you meet your goals. This will help you narrow down the web monitoring suite that provides the best value for your business.
- Start small and scale up. Begin with essential monitoring features and gradually add more sophisticated monitoring types as your needs grow.
- Establish performance baselines. Monitor your website metrics for at least a week to determine average performance levels. Then, you’ll be able to see the actual impact of any changes you make to your website.
- Map out key user journeys. Document the paths users should take through your site and compare these with actual user behavior to identify potential improvements.
- Combine synthetic and real user monitoring. This dual approach provides a more holistic view of your website’s performance.
- Monitor from multiple locations. Testing your website’s performance from different geographic regions can help identify issues that might be affecting overseas users.
- Choose appropriate alert channels. Select monitoring tools that integrate with communication platforms you actively use so you won’t miss any alerts.
- Set meaningful thresholds. Configure alerts based on business-critical metrics rather than arbitrary numbers. This can also minimize alerts to only those that need immediate attention, which prevents alert fatigue with your team.
- Create clear incident response procedures. Document how your team should react to different types of alerts and performance issues. You should also note who’s in charge of the response effort to avoid confusion.
- Review and adjust regularly. Analyze monitoring data monthly to refine thresholds and ensure you’re tracking the most relevant metrics.
Which Monitoring Service Is Right for You?
If you’re not already monitoring your website, or you’re unhappy with your current service, you should be able to find an ideal solution for you and your site in the list above. But if you’re still struggling to decide, here are my picks.
My top recommended free web monitoring tool is UptimeRobot. It offers one of the most generous free plans on the market, as you’ll get 50 uptime/downtime monitors with some basic response time monitoring thrown in.
If you need something more comprehensive, then Pingdom is my top paid monitoring tool. Its affordable paid plans start at only $10/month. Plus, it’s one of the most beginner-friendly tools out there, thanks to its intuitive dashboard that includes handy explanations of each data point.