Even before the coronavirus pandemic, the popularity of social media, online marketplaces, and guaranteed next-day delivery had the number of online shoppers soaring. When the pandemic hit us all with its lockdowns and quarantines, that number only got bigger.
So, just how many of us are shopping online? Are we actually buying products, or do we just prefer to browse? What impact do our online shopping habits have on physical stores and the environment?
Here at Website Planet, we’ve rounded up 90+ statistics, facts, and trends about online shopping, from where it all began to what to expect in the future.
The Current State of Online Shopping
More of us are shopping online than ever before, and more often too. Online shopping is dominating the retail landscape, with sales forecast to reach record highs in the next few years.
1. Global Online Sales Have Skyrocketed
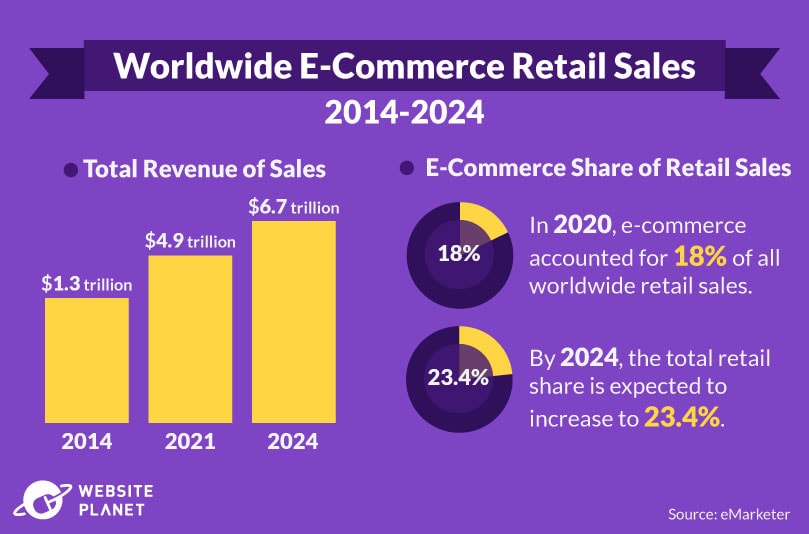
Since 2014, worldwide retail e-commerce sales have increased substantially, from $1.3 trillion to $4.8 trillion in 2021. That’s a growth of over 270% in just 7 years.
Profits generated through online shopping are also expected to grow in the next few years, with global sales estimated to reach $6.7 trillion by 2024. In fact, by 2024, e-commerce sales will be responsible for over 23.4% of all retail sales worldwide — up from around 18% in 2020.
2. The Number of Digital Buyers Is Growing From Year to Year
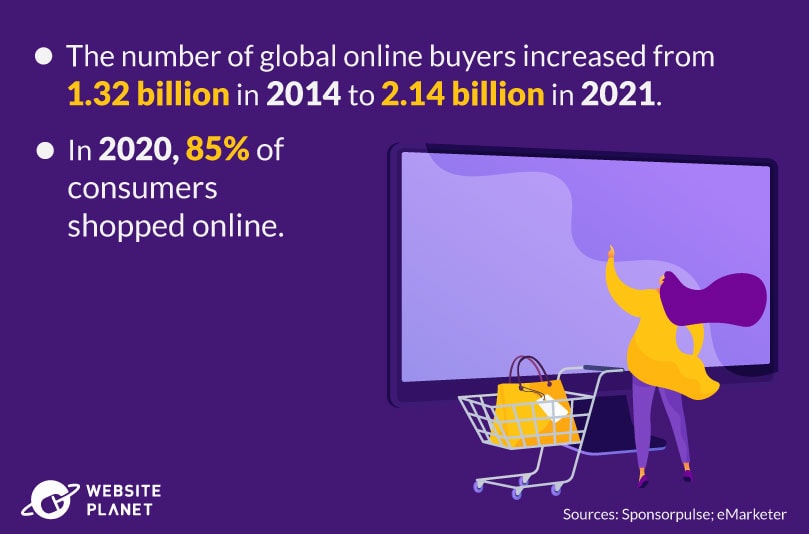
The percentage of online sales is increasing as a total of all retail, as more people turn to the web to purchase goods.
Between 2014 and 2021, the number of online buyers increased from 1.32 billion to 2.14 billion people worldwide.
In 2020, around 85% of consumers shopped online. While likely influenced by the pandemic and physical store closures, this figure had been steadily increasing before COVID-19 changed everything.
3. The Majority of Online Purchases Worldwide Are From Digital Marketplaces
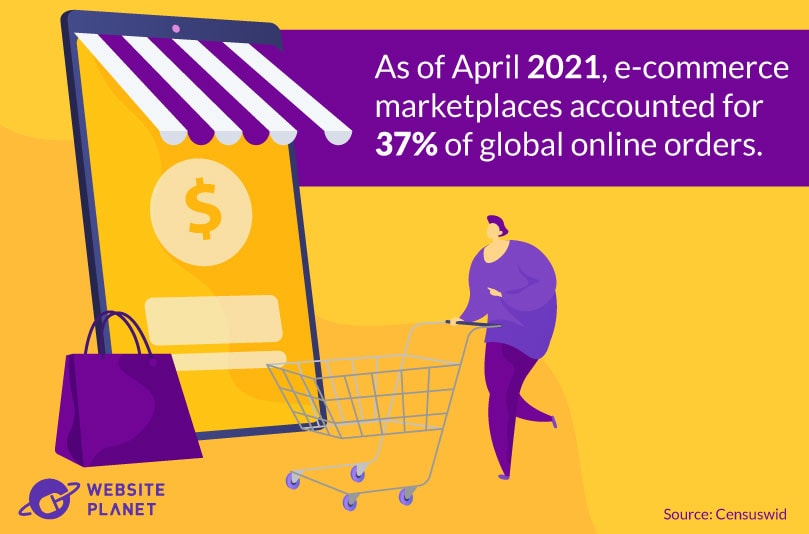
Almost a quarter of all online purchases are made through digital marketplaces, including sites such as Amazon, Alibaba, JD, and eBay.
As of April 2021, e-commerce marketplaces accounted for 37% of all global online orders. Amazon alone made up 14% of those orders.
Supermarkets and online grocery stores came in second, with around 18% of all orders. Online retailers, including ASOS, Boohoo, John Lewis, and Argos, accounted for approximately 12% of all online purchases.
4. Smartphones Are Driving Online Purchases
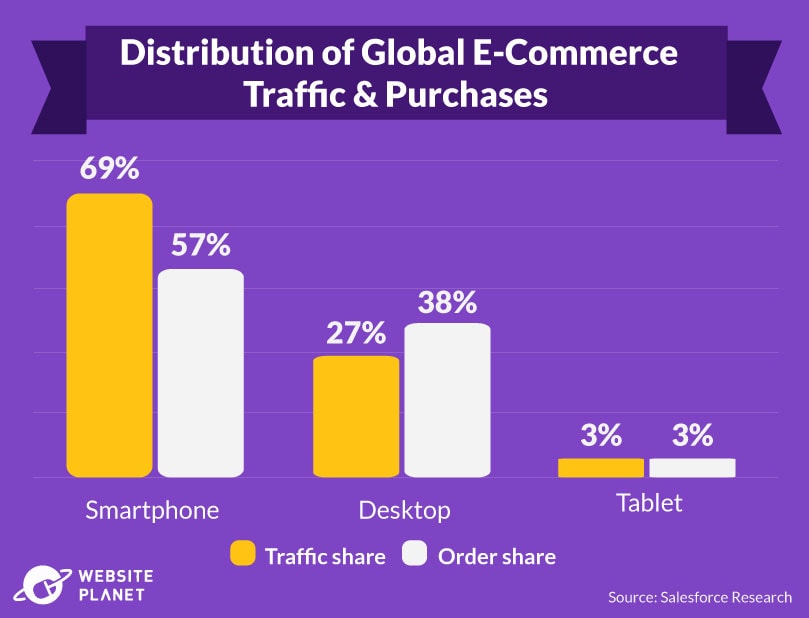
Smartphones make up the majority of online traffic for digital e-commerce.
In the first quarter of 2021, 69% of all global e-commerce traffic came from mobile phones. Desktops, by comparison, accounted for 27% of online traffic, while only 3% of e-commerce site visits came from tablets.
Interestingly, however, desktops have a much higher conversion rate, with people more likely to purchase goods if they’re shopping via desktop. While 69% of all traffic came from mobile phones, only 57% of online purchases were made through them. Desktops actually accounted for 38% of all online orders, despite lower traffic overall.
5. Online Shopping Penetration Rates Around the World
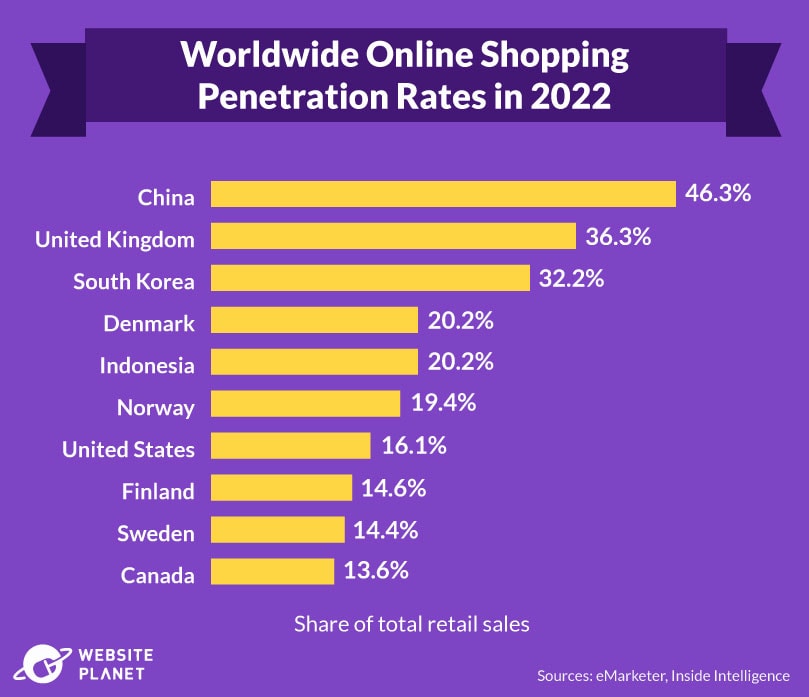
One country leads the way in online retail sales.
As of 2022, China accounts for around 46% of all online sales, making it the most penetrated market for e-commerce worldwide. The UK is ranked second, with a penetration rate of 36.3%, while in the US, only 16% of sales are completed online.
6. E-Commerce Sales Will Grow Rapidly Worldwide
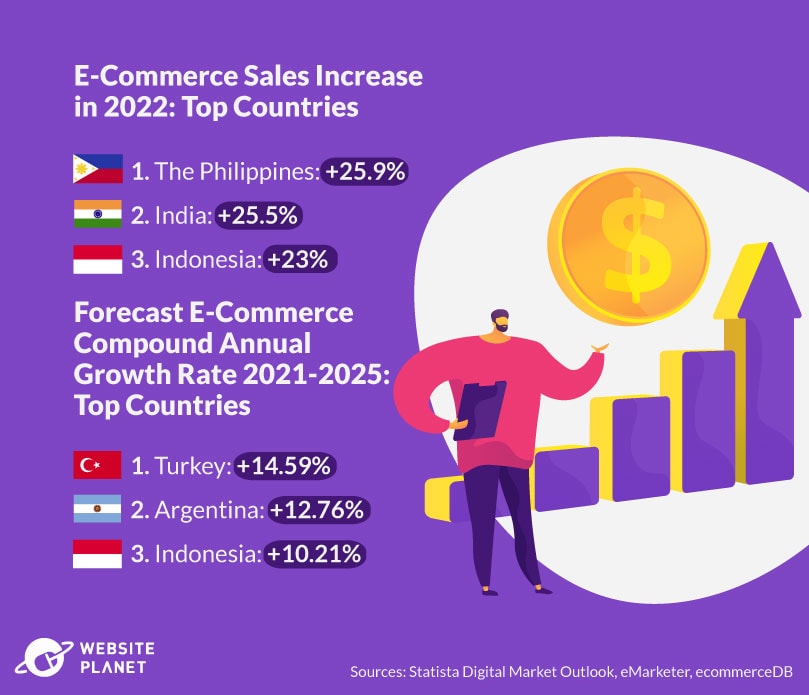
In 2022, online sales growth is predicted to increase dramatically throughout Asia and the Americas. The Philippines is expected to see the most growth, with an estimated 25.9% increase in sales, closely followed by India with 25.5%, and Indonesia with a 23% rise in sales.
In terms of compound annual growth rate (CAGR), all countries are forecast to see substantial growth in e-commerce. This refers to the estimated annual growth in revenue over a set period.
Turkey is forecast to have the most growth, with a CAGR of 14.59% between 2021-2025. In 2021 alone, Turkey generated over $16 billion in e-commerce revenue, with fashion the top category for online shopping.
7. Amazon Is the Most Visited Online Retail Site
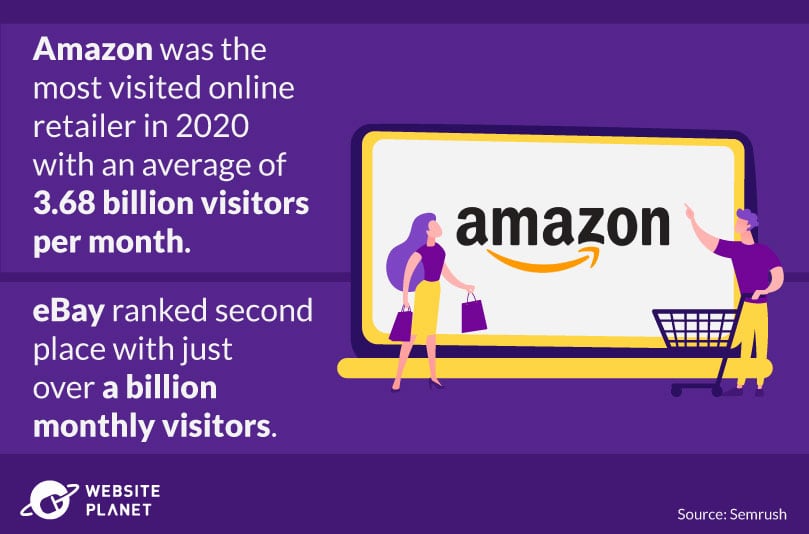
Traffic to all online retail sites surged throughout 2020, with the pandemic forcing billions of people worldwide to shop online instead of in physical stores.
Among the retailers with the most increase in traffic was Amazon, which saw a global average of 3.68 billion unique visitors per month over the year, making it the most visited e-commerce site in the world.
eBay came in second place with just over a billion visitors per month in 2020.
8. How Often Do We Shop Online?
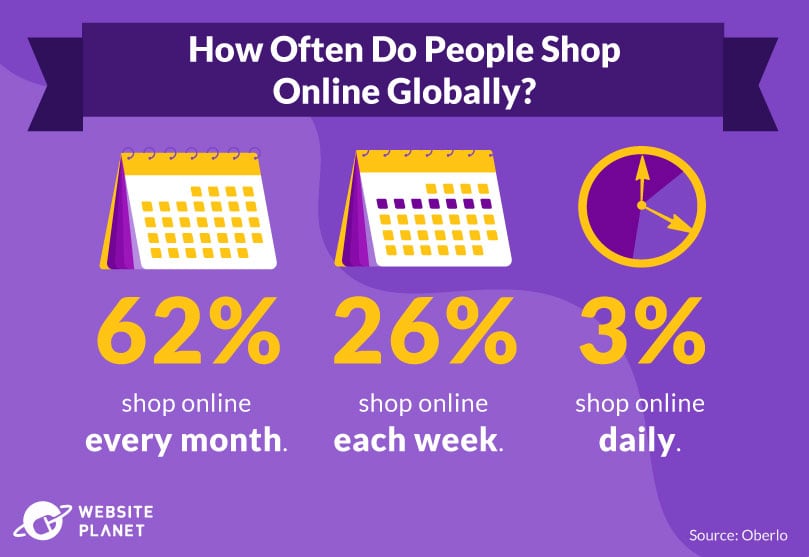
Globally, approximately 2.14 billion of us purchased goods online in 2021.
Most consumers claim to shop online at least monthly, with 62% of global buyers purchasing goods online every single month. Some of us are more frequent shoppers, though. Around 26% of consumers shop online each week, while some 3% of online shoppers visit e-commerce channels every single day.
9. Top Online Shopping Categories
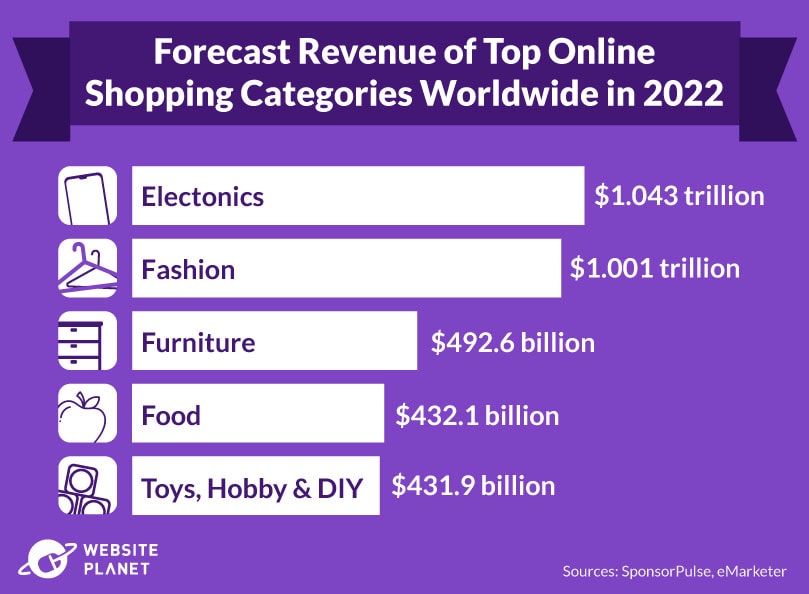
Both electronics and apparel lead the e-commerce space, accounting for the majority of online revenue. As of 2022, electronics is the top online shopping category, with consumers forecast to spend around $1.4 trillion in the tech category. In relation to total e-commerce revenue, that means electronics will be responsible for almost a quarter of all online sales.
Online fashion sales are estimated to generate $1 trillion. In third place, furniture is predicted to generate around $492 billion in 2022.
10. Leading Reasons for Purchasing a Product Online
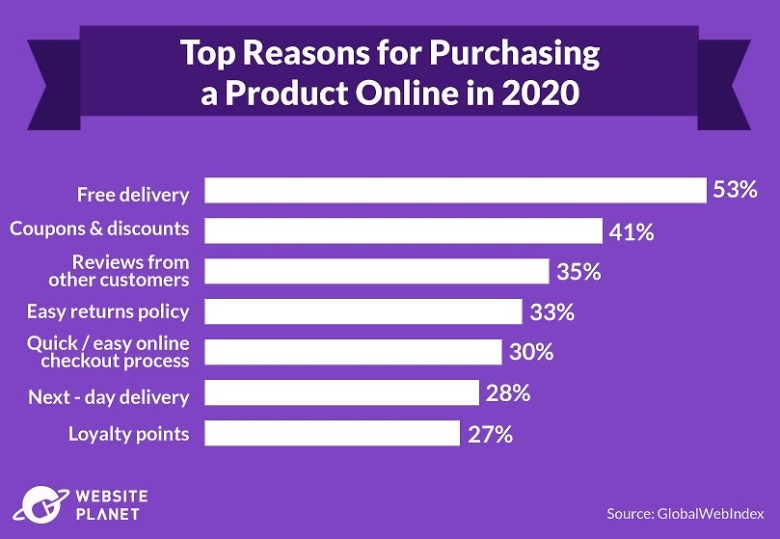
A 2020 worldwide survey showed some key reasons why consumers choose to shop online.
In the survey, consumers stated free delivery as the biggest motivation, with 53% of respondents. 41% also named coupons and discounts as a top reason for buying a product online.
Consumers also identified reviews from other customers, easy returns policies, and a quick and easy checkout process as factors that would sway them towards purchasing goods online. For online retailers that don’t currently offer these benefits, especially discounts and an enhanced customer experience, now is the time to rethink their strategy.
The History & Evolution of Online Shopping
E-commerce is everywhere, but where did it actually come from? When did we start switching from in-store shopping to online marketplaces?
11. Online Shopping: A Timeline

Many people are surprised to learn that online shopping has been around for over 40 years!
1969: The Launch of CompuServe
CompuServe was founded in 1969 by two students, Dr. John R. Goltz and Jeffrey Wilkins, and is widely recognized as the first company to provide online services like email and other pioneering technologies that later made e-commerce possible.
1979: Electronic Shopping Is Invented
Michael Aldrich, an English inventor, combined a telephone line, TV, and a transaction-processing computer to invent a system that allowed for secure purchasing, messaging, and information sharing. This is the earliest known example of electronic shopping.
1982: The World’s First E-Commerce Company Launches
Boston Computer Exchange was the world’s first known e-commerce company, launching in 1982. It served as an online marketplace for buying and selling used computers.
1992: The Online Bookstore Emerges
In 1992, Charles M. Stack invented the first online bookstore, Book Stacks Unlimited. The company initially used a dial-up bulletin board system to run the store, but switched to the Books.com internet domain in 1994.
1994: A Web Browser Takes the World by Storm
Netscape Navigator was created by Marc Andreessen and Jim Clark and was the most used web browser of the 90s. By 1995, it had 10 million users worldwide.
1995: Introducing… Amazon & eBay
Jeff Bezos launched the world’s most visited e-commerce marketplace, Amazon. In its early days, Amazon was primarily an online bookstore, rather than the “everything store” we know today.
Amazon’s success was immediate — within 30 days of launching its online marketplace, the retail site was shipping books to 45 countries across the globe.
eBay launched the same year, with the CEO Pierre Omidyar selling just one item — a laser printer for only $1. By 1997, users submitted over 2 million auction transactions through eBay.
1998: E-Commerce Sees a New Payment System
PayPal first launched in 1998, though it was then known as Confinity. Purchased by eBay in 2002, PayPal was originally a mere transfer system to enable digital payments between online businesses and customers. Within 3 years of launch, PayPal had handled more than $3 billion in money transfers.
1999: Alibaba Enters the Market
Alibaba is one of the most widely used online marketplaces and has been since its launch in 1999. It received funding from Goldman Sachs and SoftBank of approximately $25 million to launch.
The Early 2000s: The Booming Marketplace
The early 2000s saw new players entering the e-commerce market, beginning with Google AdWords. The platform allowed online businesses to effectively reach their target audience through paid search tools.
Some years later, Shopify entered the online shopping space. Initially, the co-founders planned to use Shopify as a tool to buy and sell snowboarding equipment, though the online platform looks very different today.
A year later, in 2005, Amazon launched the Amazon Prime Membership. The goal was to provide customers with free 2-day shipping for a set annual fee.
2005 also welcomed Etsy into the marketplace as a marketplace for homemade and personalized goods.
2009: BigCommerce Enables Online Businesses to grow
BigCommerce was founded by two Australians, Eddie Machaalani and Mitchell Harper. The platform was designed to be a one-stop platform for online businesses, offering marketing and selling tools and facilitating payments and transactions.
2011: Google Wallet Emerges as a New Payment Method
Google introduced a new online payment system known as Google Wallet. This was the first peer-to-peer transfer service to allow smartphones and other digital devices to be used to pay for goods. Today, Google Wallet is known as Google Pay.
2011: Social Media Becomes an Advertising Channel
In 2011, social media started to become a channel for helping online businesses reach target customers. Facebook introduced sponsored ads for business accounts, where businesses could pay a fee to target their audience with paid campaigns.
2014: A New Payment Method: Apple Pay
With the success of Google Wallet 3 years prior, Apple followed suit, introducing Apple Pay. The new peer-to-peer payment method allowed Apple users to add debit cards to a virtual wallet, which they could use to purchase goods. While initially launched only for iPhone, Apple Pay is now available across numerous devices, including the Apple Watch, making it easier than ever to pay online.
2017: Instagram Becomes a Selling Platform
Instagram partnered with BigCommerce to launch direct links to product pages, so Instagram users could find products and services to purchase while browsing their feeds.
2020: Welcome to Facebook Shops
Facebook Shops was launched in 2020. It allows businesses to sell their products and services directly on Facebook or Instagram, without the need for a third-party platform.
2020: Online Shopping Splurge
The pandemic forced storefronts all over the world to close, leaving consumers no option but to shop online. E-commerce sales skyrocketed, reaching $82.5 billion by May 2020 — a 77% increase from 2019. Without the pandemic, analysts were forecasting it to take as much as 6 years to generate that much revenue.
Online Shopping Around the World
GDP, family income, access to technology, and access to physical storefronts all influence whether or not a consumer will shop online.
13. E-Commerce in China
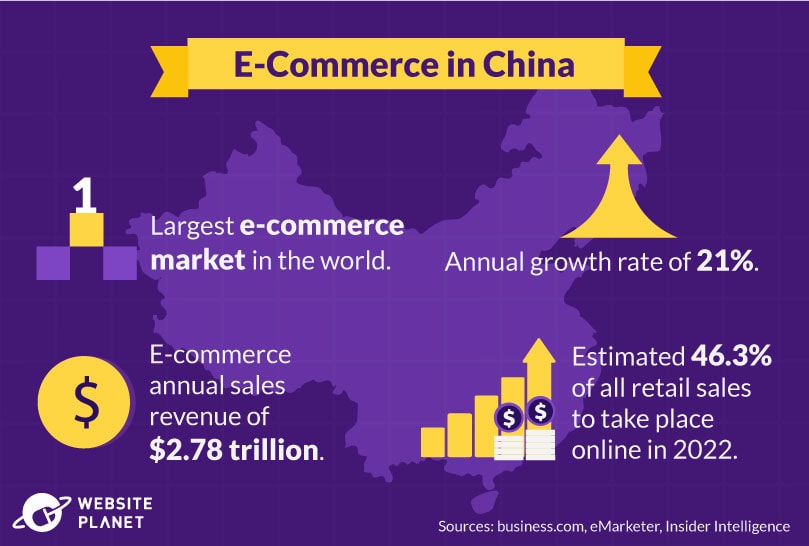
China has the largest e-commerce market in the world, with annual online sales exceeding $2.78 trillion and an impressive annual growth rate of 21%. However, that still represents a small portion of the country’s population.
In 2022, this might change. China is forecast to experience much greater penetration in e-commerce, with 46.3% of all retail sales occurring online.
14. E-Commerce in the US
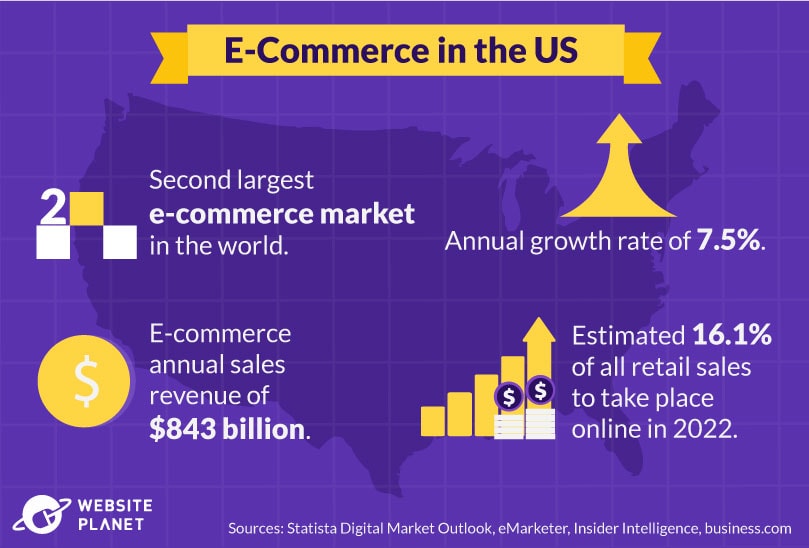
The US is the second largest e-commerce market, generating around $843 billion in annual sales.
It also has one of the highest online shopper penetration rates, thanks to the success of e-commerce giants such as Amazon, eBay, and Walmart. In 2022, 16.1% of all retail sales are estimated to occur online.
Although far behind China, the US online shopping market is growing at a steady rate of 7.5% per year, which is set to continue through 2025.
15. E-Commerce in the UK
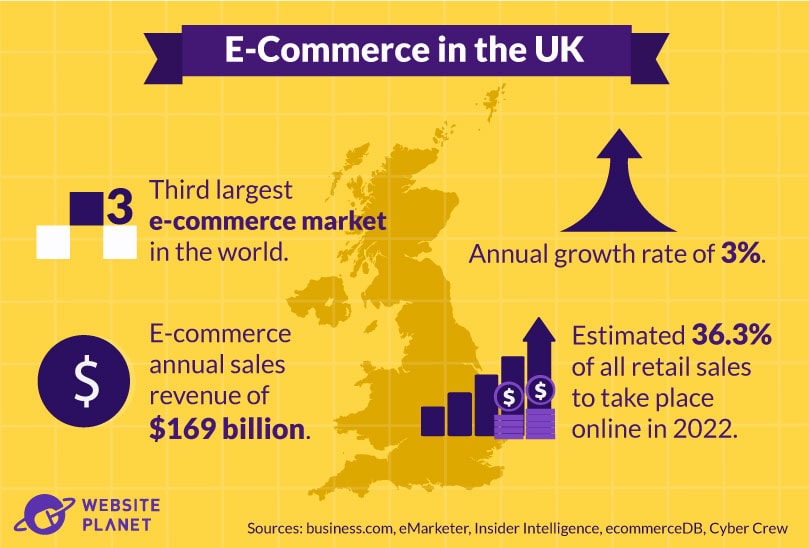
The UK generates around $169 billion in annual online shopping sales, with a projected growth rate of 3% between 2021-2025.
In 2022, over a third of all retail sales in the UK are forecasted to come from online shoppers. The UK also holds one of the highest penetration rates, with approximately 87% of the UK population shopping online in 2020.
16. E-Commerce in Japan
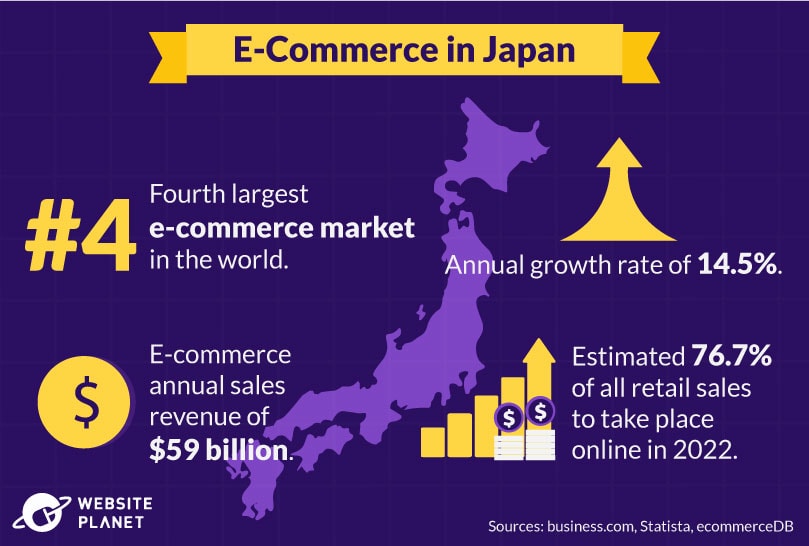
Japan is the fourth largest e-commerce market globally, though it has one of the highest online buyer penetration rates. Around 74% of the total population shopped online in 2021, which is set to rise to 76.7% by the end of 2022.
In terms of total sales, Japan brings in approximately $144 billion in revenue per year. This figure is set to increase, with an annual growth rate of 6% between 2021-2025.
17. E-Commerce in South Korea
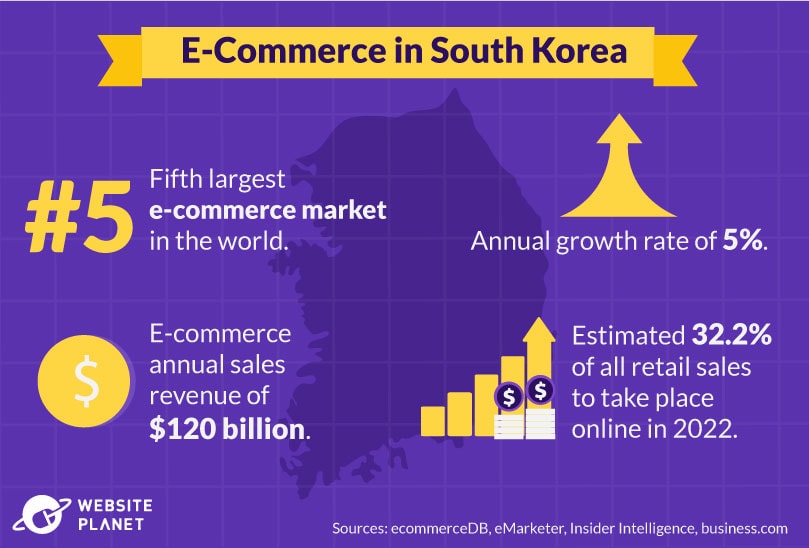
South Korea is the fifth largest e-commerce market in the world, generating an impressive $120 billion annual online sales, thanks in part to the well-known online stores Gmarket and Coupang.
Over the next 3 years, South Korea’s e-commerce market space is expected to grow substantially, with an annual growth rate of 5%.
Approximately 32.2% of all retail sales in the country are estimated to come from e-commerce in 2022, making it the third fastest-growing e-commerce market globally.
18. E-commerce in Europe Is Most Popular in the West
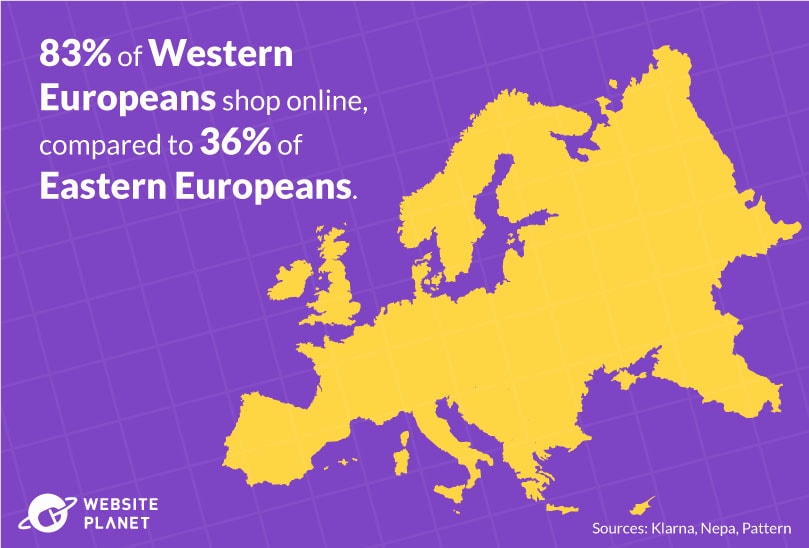
Trends show that online shopping is more popular in Western Europe than in other European regions. Perhaps not coincidentally, Western Europe is one of the wealthiest regions in the world.
In 2020, 83% of Western Europeans said they shopped online, ahead of Northern Europe (79%) and Central Europe (69%). Eastern Europe had the smallest percentage of online buyers – just 36%.
In Germany — one of the most developed Western countries — around 40% of consumers shopped online every week in 2021. The Netherlands also has a high percentage of online shoppers, with 32% of the population buying goods online weekly.
However, in all European countries, more people still choose to visit physical stores. Across Western Europe: over 60% of people shop offline each week.
19. Online E-Commerce Revenue Shares in European Countries
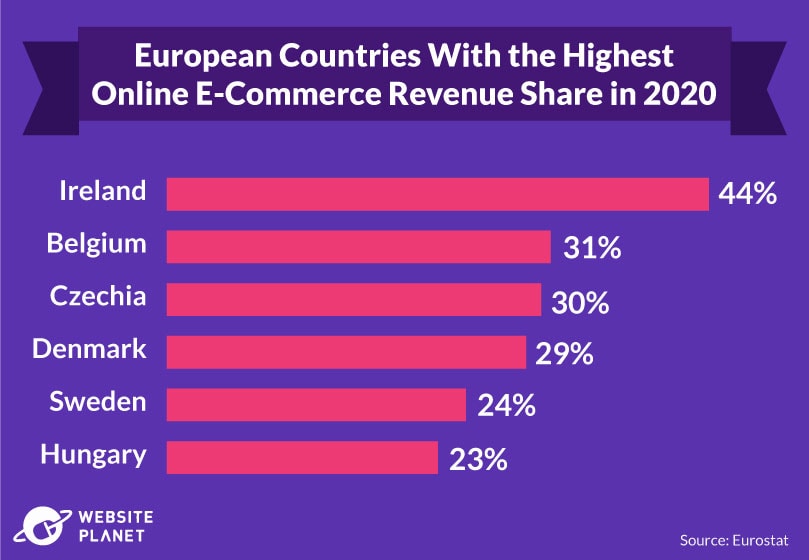
Interestingly, the most developed European countries aren’t necessarily the same ones that generate the most revenue in online sales.
Although Germany and the UK have some of the highest online shopping consumer penetration rates, neither country made the top 10 in terms of revenue their companies made from online sales. In total, the e-commerce revenue share in Germany was 18% in 2020, and 21% in the UK.
In Ireland, companies generated 44% of their revenue from online orders – the highest of all European countries, followed by Belgium with 31%.
20. Online Shopping Spending in the APAC Region
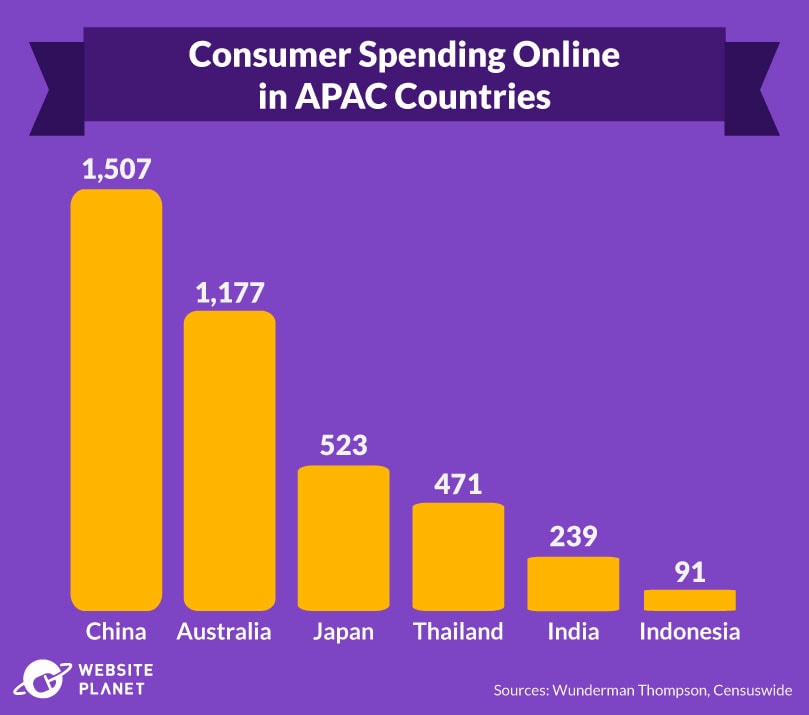
Asia is home to some of the largest e-commerce markets, including China. Consumers in these countries are, in general, also willing to spend big bucks online.
In 2021, Chinese consumers stated they’d be willing to spend around $1,500 on a single online purchase. 72% of Chinese shoppers say they shop online at least 2-3 times a week.
Consumers in Australia are also willing to splash the cash on online purchases. Australian shoppers spend, on average, $1,177 online. But in less-developed economies, such as Thailand and Indonesia, spending plummets.
Online spending drops to around $471 in Thailand, while Indonesia is even less, with consumers only willing to spend $91.
21. Asian Market Heads to Social Commerce for Online Purchases
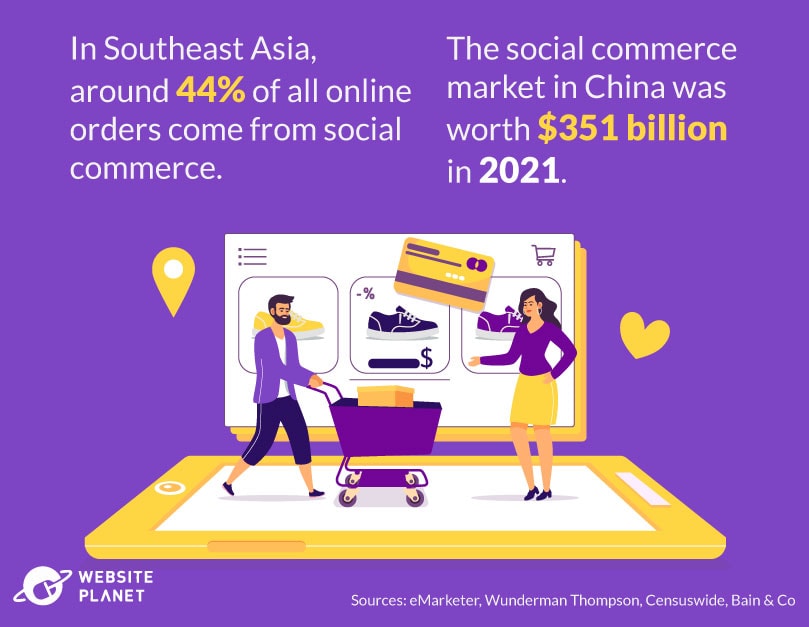
New social media features allow consumers to shop directly on the platforms without visiting another website.
In China, the social commerce market was worth a whopping $351 billion in 2021 and is expected to rise to $507 billion by 2024.
In Southeast Asia, around 44% of all online orders come from social channels. Vietnam, Thailand, and the Philippines, particularly, have sizeable social commerce markets, where shares ranged between 30-50% of total online sales in 2020.
22. MENA E-Commerce Market Expanding
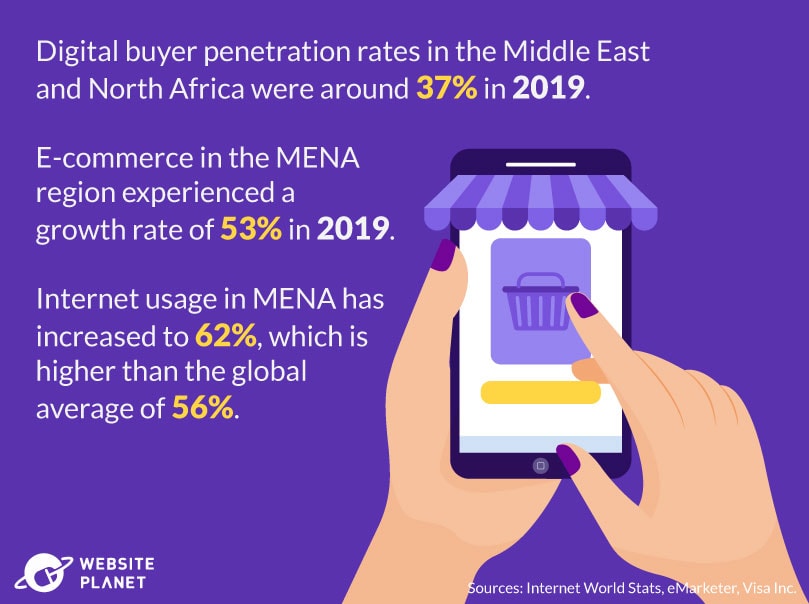
E-commerce penetration in the Middle East and North Africa (MENA) is growing slowly but steadily, with year-over-year increases since 2014.
In 2019, around 37.6% of all consumers in the region shopped online, up from 33% in 2014. This is significantly lower than online buyer penetration rates in other areas of the world, perhaps linked to a much lower GDP.
In terms of total sales, e-commerce accounted for just 3.6% of all retail across the MENA region in 2019. However, the e-commerce market experienced a growth rate of 53% in the same year, showing that things are changing.
The growing e-commerce market is a direct result of the dramatic increase in internet users in the region, which has been rising faster than the global average for many years.
As of 2019, 67.2% of people in the region were using the internet. As the availability of digital infrastructure increases, we can likely expect more in the way of e-commerce in MENA.
The Biggest Online Retailers
Which online retailers are the most popular? Certain e-stores are leading the marketplace with sky-high sales and huge numbers of visitors.
23. 5 Largest Online Marketplaces
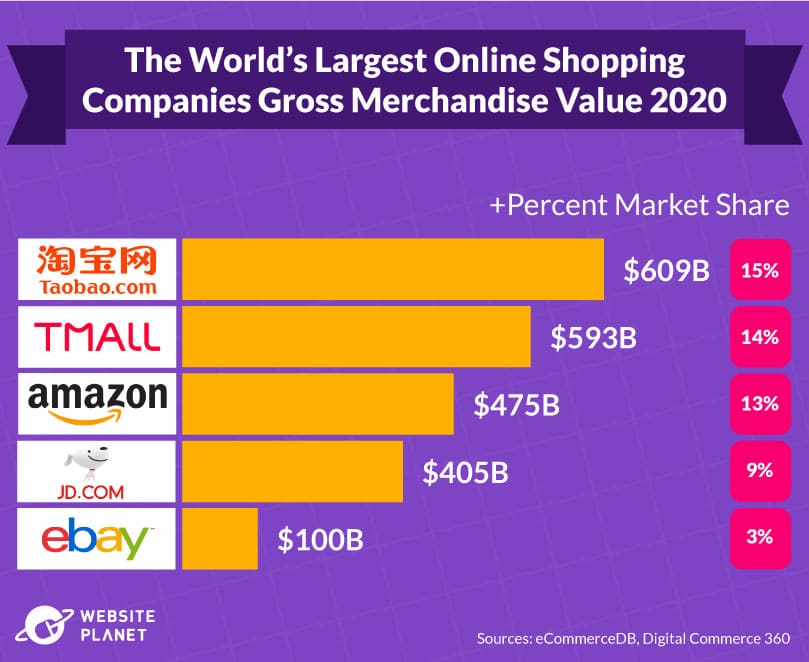
While e-commerce giants like Amazon and eBay make the list of the world’s largest online retailers, Taobao has the most market share.
Owned by Alibaba, the Chinese-based company generated an impressive $490.3 billion in 2019, increasing to $609 billion in 2020 — a growth of 24% in just 12 months.
Tmall — also owned by the Chinese e-commerce company Alibaba — ranks second, generating $593 billion in online sales in 2020. In fact, 3 out of 5 of the world’s largest online marketplaces are primarily based in China, with JD.com also making the list.
Amazon comes third, bringing in $475 billion in gross merchandise value in 2020.
24. Amazon Has the Largest Market Cap Globally
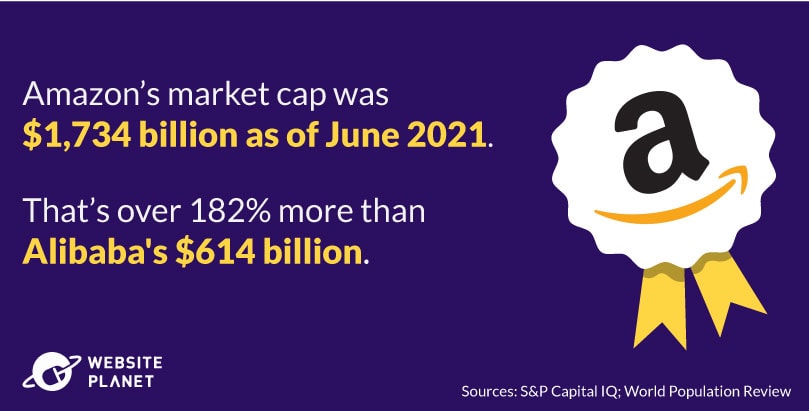
Although Taobao and Tmall might be the largest e-commerce stores, Amazon has the largest market cap. This refers to a company’s value traded on the stock market. It’s the total number of shares multiplied by the share price.
Alibaba — the owner of Taobao and Tmall — held a market cap of around $614 billion as of June 2021. Amazon’s market cap is substantially larger at $1,734 billion — a difference of over 182%. Comparing this to GDP, that means Amazon would rank #12 in the world, putting it ahead of Russia!
25. Fastest Growing Online Marketplaces Worldwide
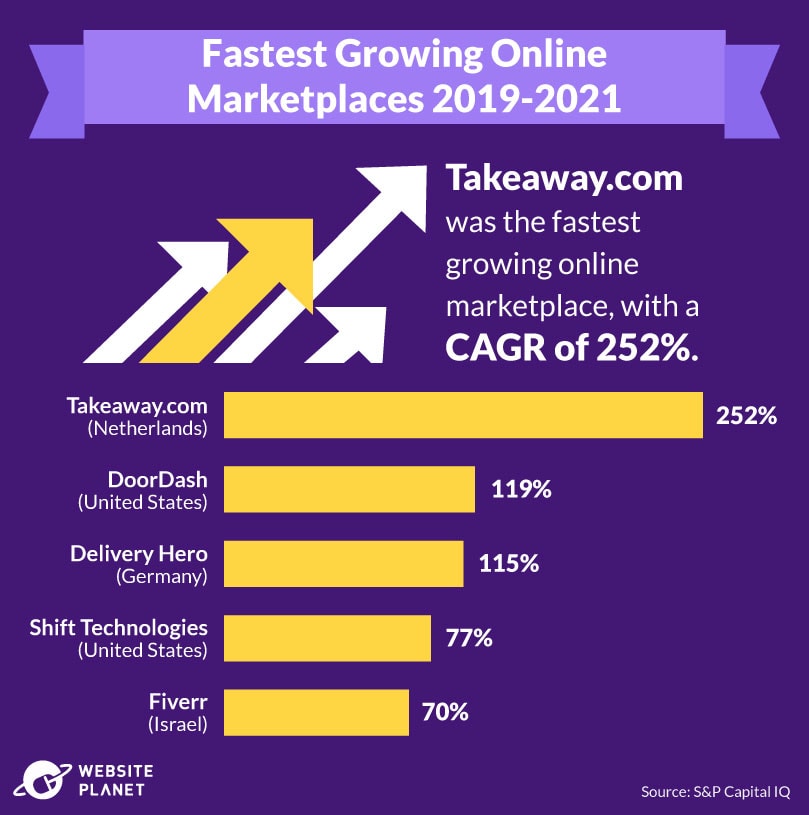
Between 2019 and 2021, food-related online marketplaces dominated the space. Netherlands-based Takeaway.com had the fastest growing CAGR in the sector, seeing a 252% growth over the two years.
Food delivery services DoorDash and DeliveryHero also saw growth of over 110%.
26. Most Popular Online Marketplaces in the US
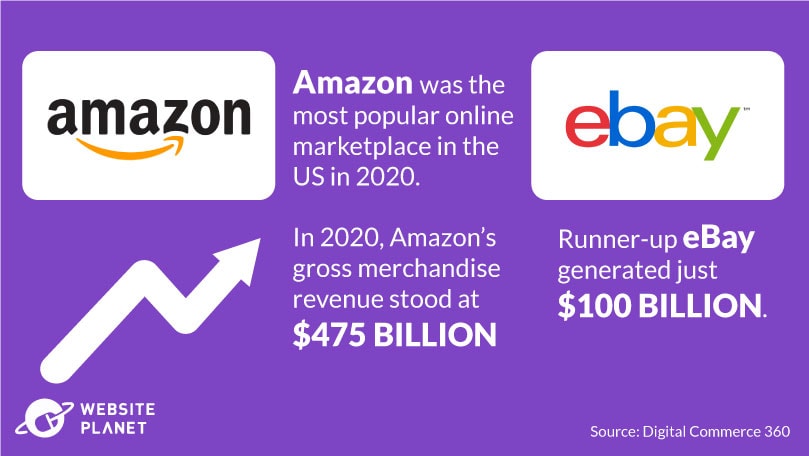
With the largest market cap worldwide, it’s no surprise that Amazon was the most popular online marketplace in the US in 2020.
Throughout 2020, Amazon generated a gross merchandise revenue of $475 billion. That’s substantially higher than eBay – the second most popular US online marketplace, with $100 billion in revenue.
Walmart, Wish, and Offerup also made it into the top 5 most popular online marketplaces in the US.
27. Most Visited Online Marketplaces in the US
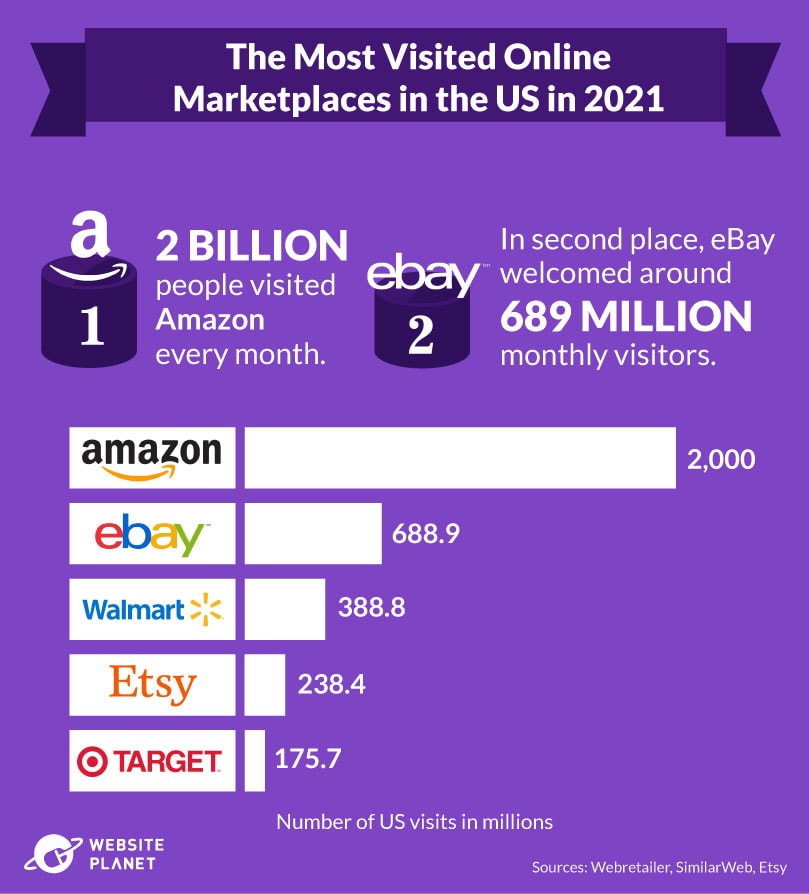
We can see a clear link between revenue and monthly visits to online marketplaces.
In April 2021, Amazon had over 2 billion monthly visitors, while eBay only had 688.9 million. Walmart.com saw around 388 million people, and the site is also ranked third in gross merchandise value.
Interestingly, Etsy and Target were two of the most frequently visited e-commerce sites, despite a relatively low gross merchandise value compared to other e-commerce sites. However, Etsy’s online sales increased by over 106% between 2019 and 2020.
28. eBay Is a US Seller’s Market
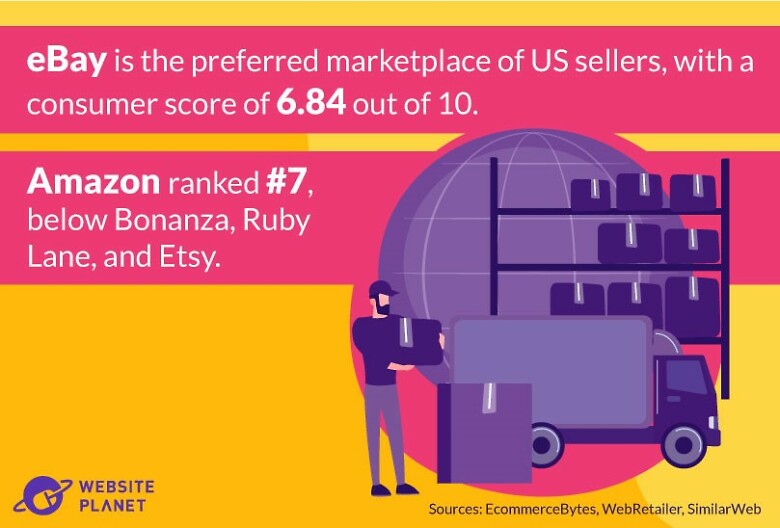
A 2021 survey revealed that sellers in the US rank eBay over other marketplaces in important metrics, even though eBay ranks second in revenue and monthly visits.
Sellers gave eBay a score of 6.84/10 overall when considering:
- Profitability
- Customer service
- Communication
- Ease of use
- Whether they would recommend the marketplace to other sellers
Amazon, on the other hand, ranked in 7th place with a score of 5.13 – lower than much smaller competitors such as Bonanza, Ruby Lane, and Etsy.
29. Apple Is the Fastest Growing Online Store in the US
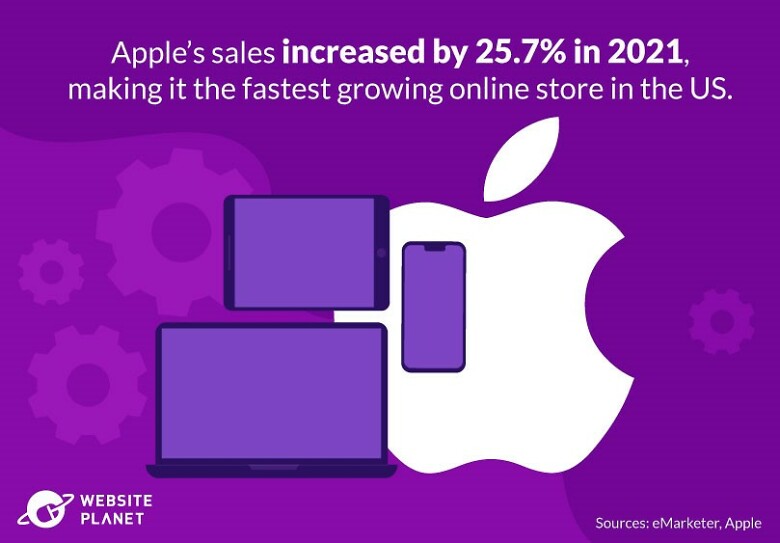
When it comes to fast-growing e-commerce platforms in the US, Apple comes in first.
In 2021, Apple’s online sales surged by 25.7% in the US alone. Worldwide, Apple generated over $365 billion in revenue in 2021 — up $91 billion from the year before, and more than triple their revenue of 10 years ago.
E-commerce company Chewy — an online pet supplies store — was the second-fastest growing online store in the US, with a 25% increase in sales in the same year. In third place, Amazon’s sales increased by 21.7%, followed by Etsy and Costco.
30.MercadoLibre Comes in First in Latin America
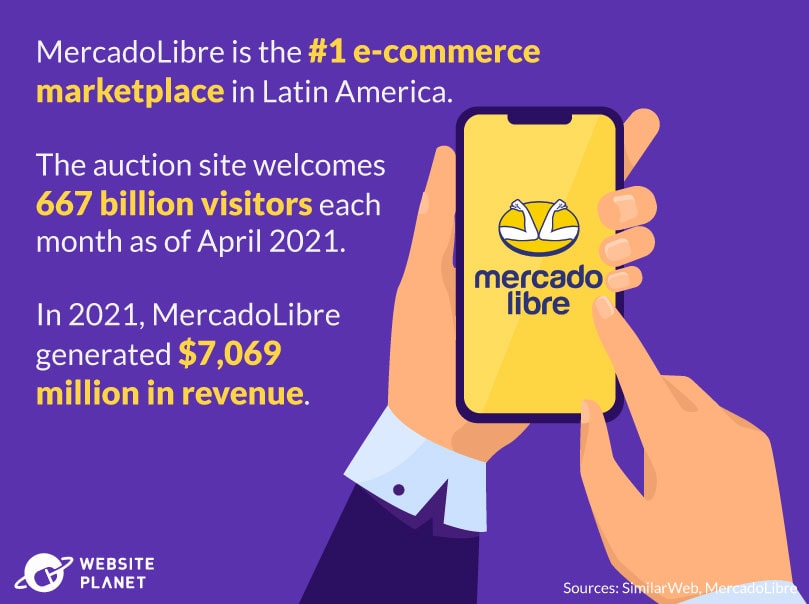
Netherlands-based auction site MercadoLibre is the largest online marketplace in Latin America, boasting 668 million visitors every month as of April 2021. This is leaps and bounds ahead of Amazon, in second place, which attracts just 169 million monthly shoppers in the region.
MercadoLibre has steadily grown in popularity, particularly in Brazil and Peru. However, the pandemic helped the marketplace double its sales in other Latin American countries, including Chile, Colombia, and Mexico.
Thanks to increased sales during COVID-19, MercadoLibre is now the #1 e-commerce store in Latin America, with a revenue of $7,069 million in 2021. That’s an increase of more than 77% from the year before.
31. Europe’s Leading Online Marketplaces
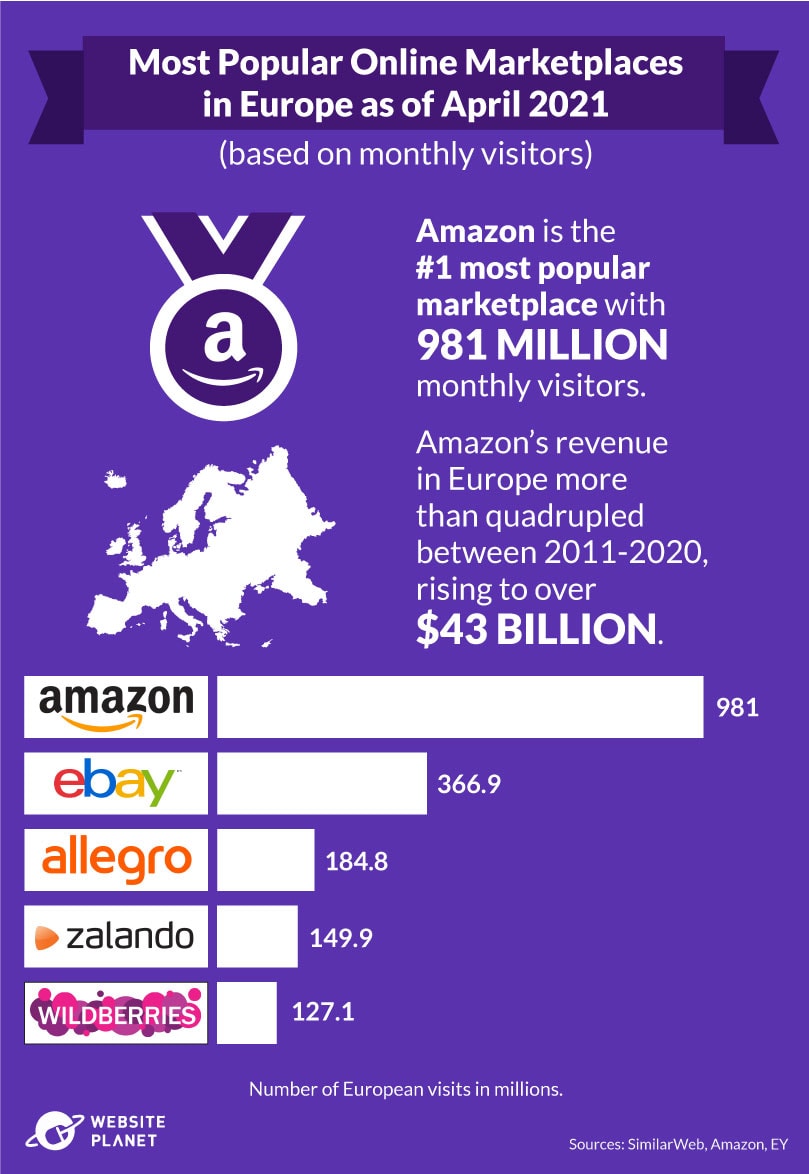
The trends in Europe are similar to other parts of the western world, with Amazon and eBay leading the e-commerce market.
In Europe, Amazon saw around 981 million monthly visitors (as of April 2021). Consumers are regularly buying items, too – rather than just browsing; Amazon’s European revenue more than quadrupled between 2011-2020, growing from $9.1 billion in 2011 to over $43 billion by 2020.
eBay’s figures were much lower. On average, eBay welcomed nearly three times fewer European visitors than Amazon, seeing 366.9 million shoppers each month.
The Polish-based e-commerce company Allegro also made the list of top online marketplaces in Europe, with 184 million monthly shoppers looking to trade technology items. Fashion providers Zalando and Wildberries followed in 4th and 5th place, with 127.1 and 149.9 billion monthly hits, respectively.
32. UK’s Most Visited Online Marketplaces
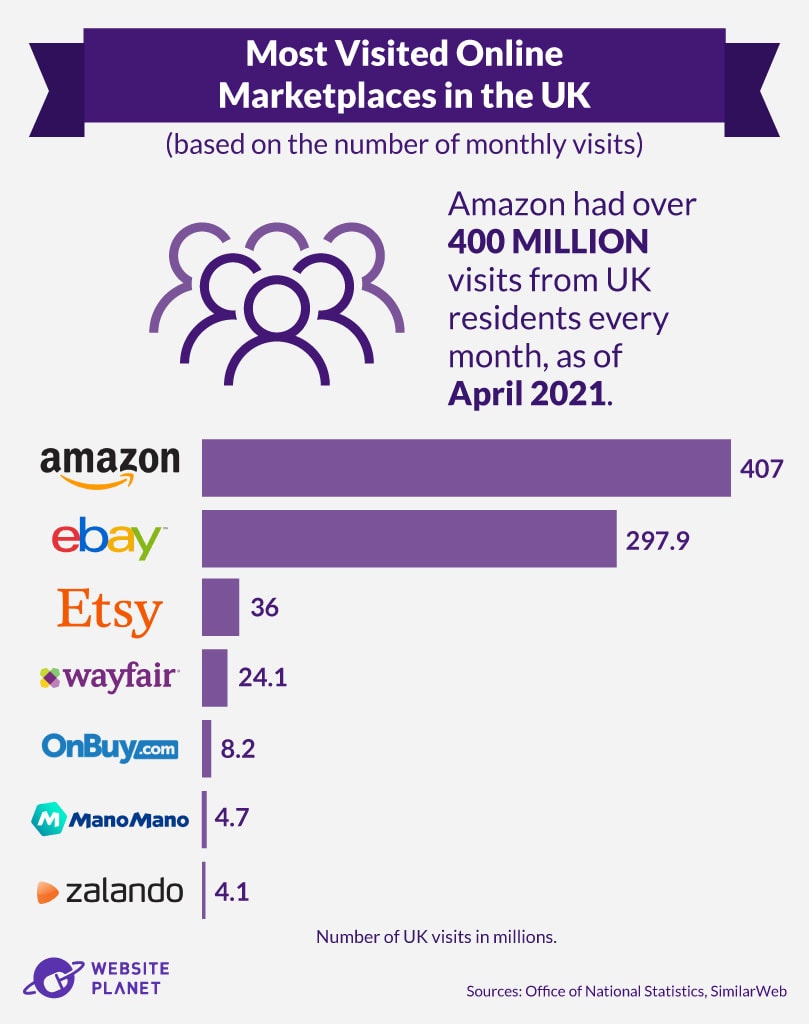
The UK e-commerce market is led by clothing, food, books, and home furnishings. In a 2020 UK survey, 55% of Brits turned to online stores to purchase apparel — the highest percentage of all categories.
Much of this traffic goes to marketplaces. As of April 2021, Amazon had just over 400 million hits every month, while eBay had nearly 300 million visits. This is in a country with a population of just over 67 million, showing that Brits make multiple visits every month.
Etsy also continues to grow in popularity in the UK, with 36 million visits from Brits every month.
Wayfair, OnBuy, ManoMano, and Zalando are also among the UK’s most popular online marketplaces.
33. UK Supermarkets Dominating E-Commerce
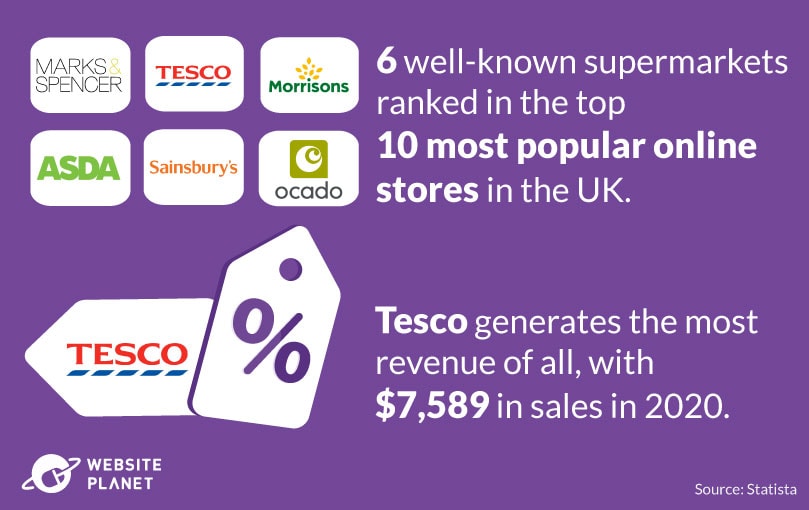
Compared to global trends, the UK has a different category in e-commerce driving online sales: supermarkets. Brits shop online for the most popular items, like clothes and groceries, rather than heading down to their local store.
Tesco is the UK’s second most popular online store, generating $7.6 billion in revenue in 2020. Sainsbury’s, Asda, Ocado, Morrisons, and Marks & Spencer are also among the online stores generating the most revenue in the UK.
Argos, Currys, and John Lewis also made the top 10 UK marketplaces, likely as shoppers head over to these stores to purchase home supplies and electronics — another of the most frequently purchased items online, both in the UK and on a global scale.
34. Leading Online Marketplaces: China
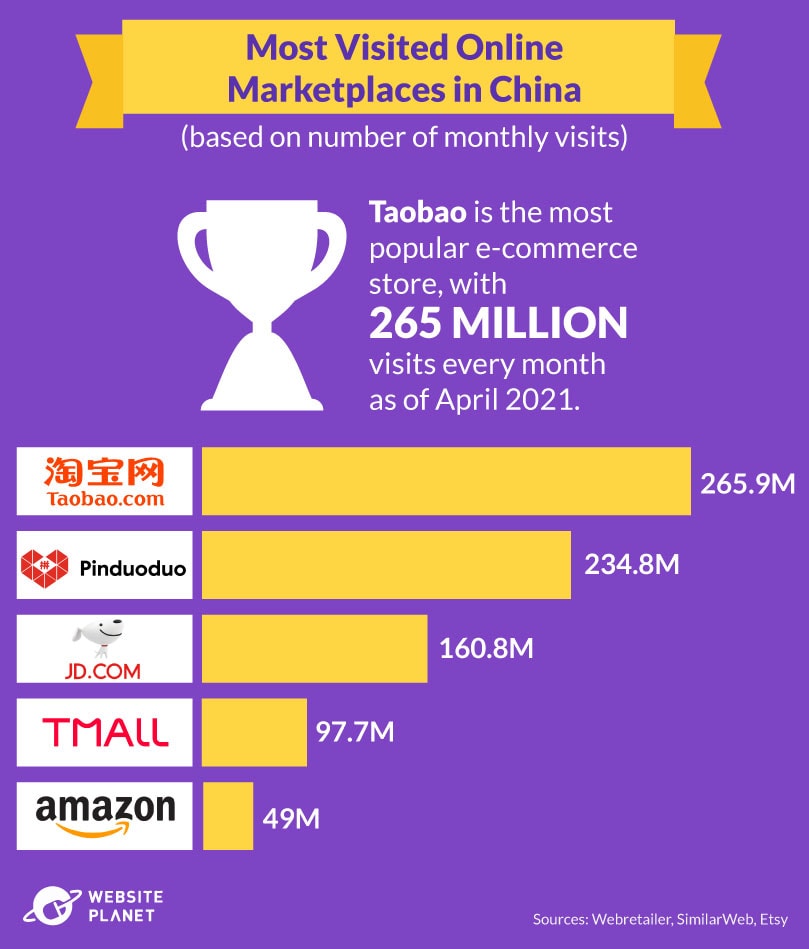
Alibaba-owned Taobao is the most popular online marketplace in China. Taobao saw around 265 million visits every month as of April 2021.
In second place is Pinduoduo, the largest online grocer in China, which offers a range of products, including home appliances, toys, and more. An impressive 234 million Chinese users visit the platform every month.
That means both Pinduoduo and Taobao see more monthly visitors from China alone than Amazon does globally, based on an average of around 200 million monthly global visits. China accounts for roughly 49 million of these visitors.
The Rise of Online Shopping Models
Online shopping takes many forms, depending on the target market and technology. There is a wide variety of online shopping models. Third-party marketplaces, customer-to-customer marketplaces, dropshipping, and business-to-business marketing are just a few examples.
35. The Dropshipping Business Model Is Expanding
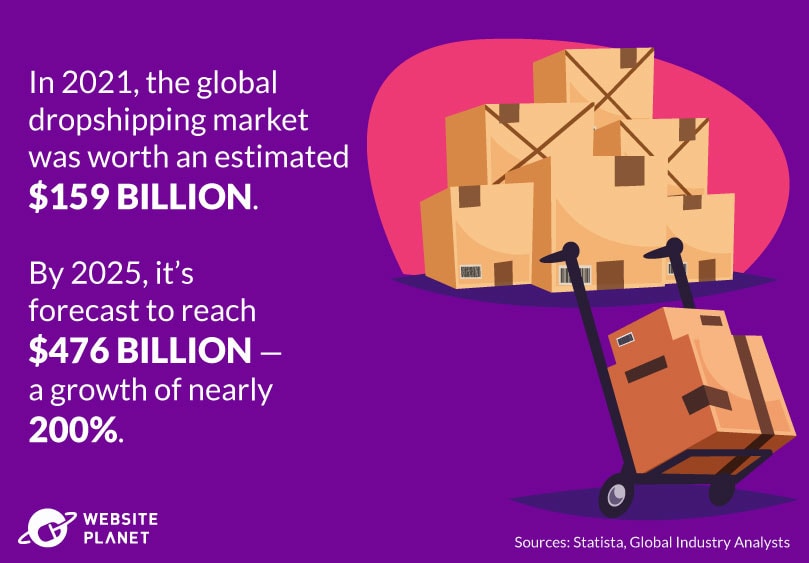
Dropshipping allows people to sell products without actually maintaining an inventory. Instead, “dropshippers” create websites selling products sourced from suppliers. The dropshipper markets the products, processes orders and payments on their website, and sends the shipment information to their suppliers, who then send the products directly to the buyers.
The dropshipper works as a middleman between buyer and supplier.
Since 2020, the dropshipping market has expanded exponentially, at least partly due to the pandemic. In 2021, the global dropshipping market was worth an estimated $159 billion. By 2026, the estimated value of the dropshipping market is expected to grow by nearly 200%, reaching $476 billion.
36. Shopify Dropshipping Sees Huge Growth
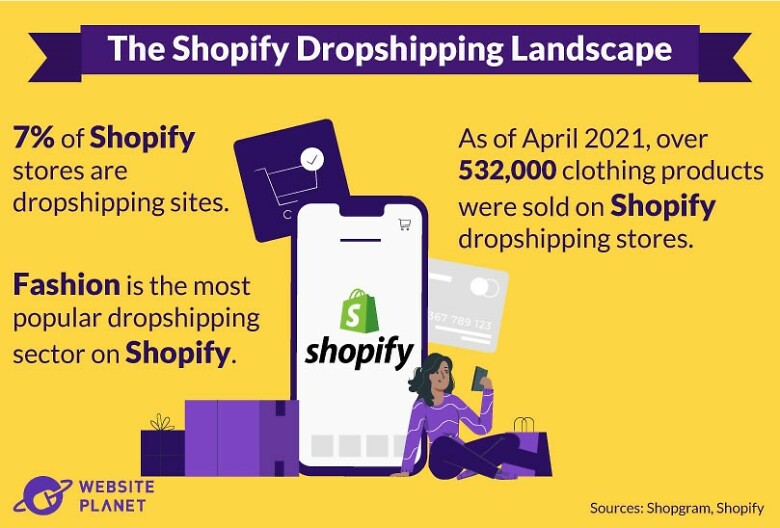
Shopify is one of the most popular platforms for building dropshipping websites
While only 7% of Shopify stores are dropshipping sites, the volume of sales is still significant.
For example, fashion-related items are the most frequently dropshipped product on Shopify. As of April 2021, over 532,000 clothing products were purchased worldwide on dropshipping stores built on Shopify, followed by home and garden with just over 369,000 products.
37. Linkedin Is Surprisingly Powerful for B2B & B2C E-Commerce
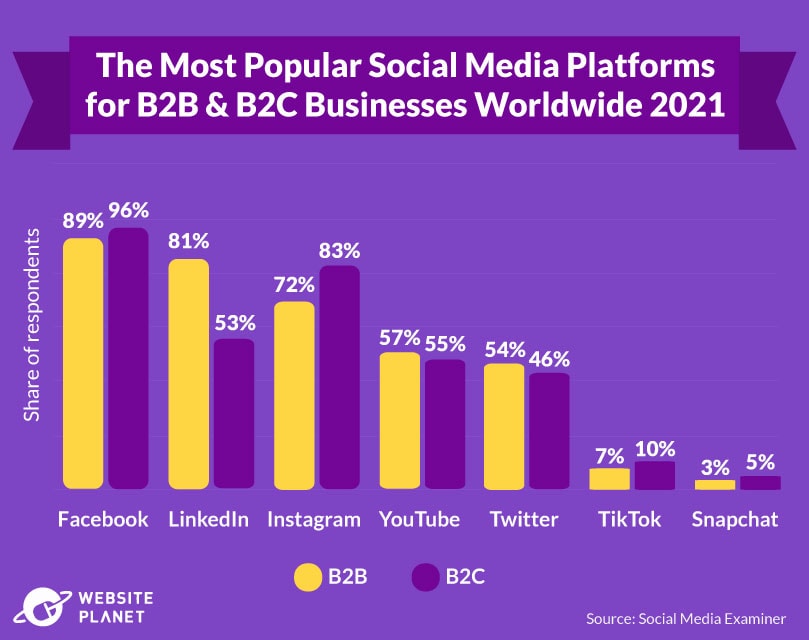
Facebook, LinkedIn, Instagram, YouTube, Twitter, Snapchat, and TikTok are among the most popular social media platforms for e-commerce. In a 2021 survey, 89% of global B2B and 96% of B2C sellers listed Facebook as the most important social media site for their businesses — the highest percentage of all platforms.
LinkedIn came second for B2B sellers, with 81% using the platform to promote their business. For B2C sellers, Instagram was the second-most-used platform, at 83%.
38. Facebook Sends Over 1 Billion Visits to Online Retailers and Marketplaces
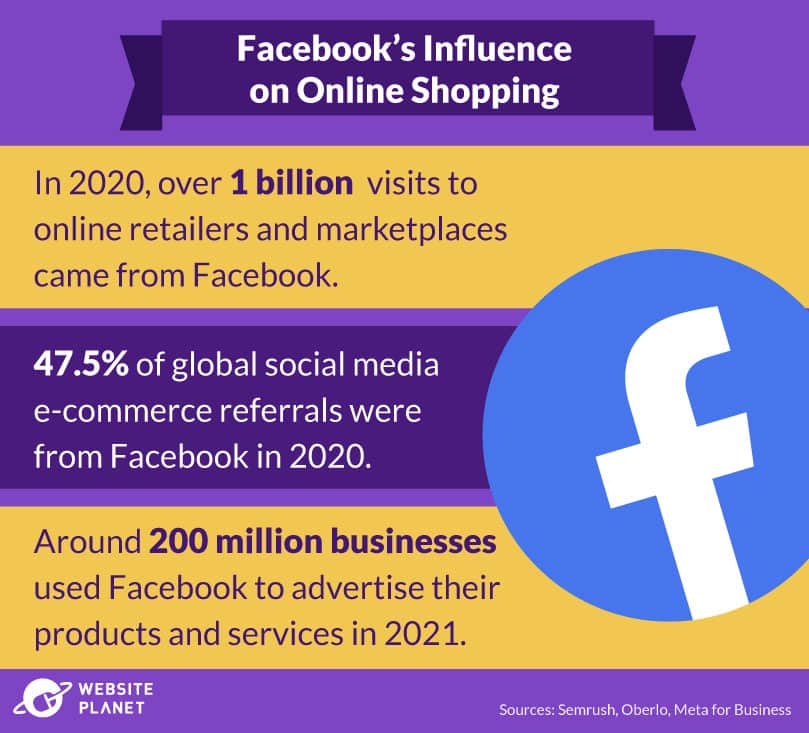
Facebook is the biggest social media platform for e-commerce retailers, accounting for over 47% of global social referral traffic to e-commerce websites in 2020. In the same year, more than 1 billion visits to e-commerce platforms came from Facebook.
Businesses use Facebook Pages to publish content, gain likes and followers, and encourage engagement. In 2021, over 200 million small businesses worldwide used Facebook to advertise their products and services.
A US Facebook survey found that 74% of consumers use Facebook to find new products or learn more about them before purchasing, making it a key influencer in purchasing decisions, too.
39. Twitter Influences B2B Purchasing Decisions
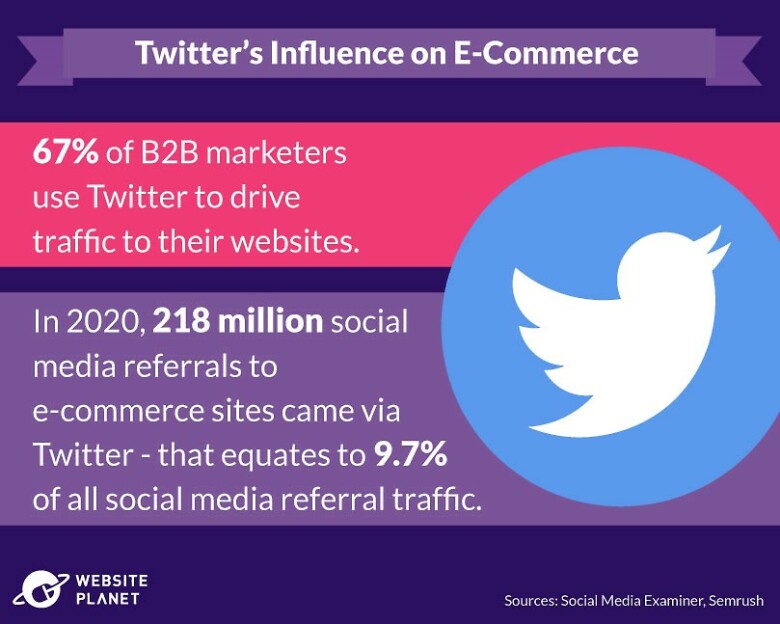
Twitter is another popular avenue for marketing, especially among B2B businesses looking to sell high-value items. According to one survey, 67% of B2B marketers use Twitter as a digital marketing tool to drive traffic to their websites.
In 2020, 218 million social media referrals to e-commerce sites came via Twitter, accounting for 9.7% of all social referral traffic.
40. Online Stores Turn to Instagram to Find Buyers
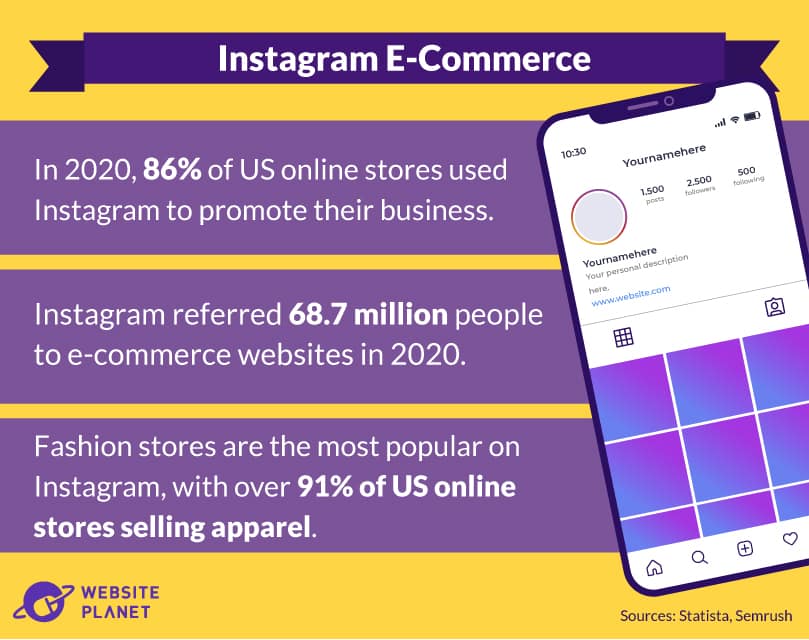
The share of online stores using Instagram to advertise their products and services has grown substantially, whether through direct shopping links, sponsored advertisements, or influencer marketing.
In 2020, 86% of US online stores used Instagram to promote their business. Over 91% of those stores sold fashion-related items. Furniture and appliances took second place, accounting for 89% of Instagram e-commerce.
While Instagram doesn’t generate as much social media referral traffic as other platforms, it still directed 68.7 million people to online retailer websites in 2020. In total, Instagram accounted for 3% of all social media referral traffic.
41. B2B E-Commerce Is Small But Growing
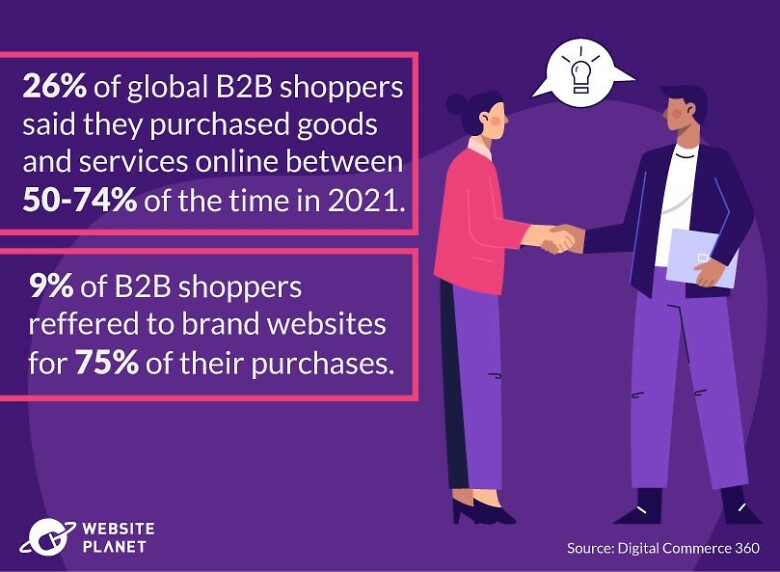
In 2021, 26% of global companies purchased goods and services online at least 50% of the time.
9% of companies said they rely on websites for at least 75% of their purchases. Only 12% said they don’t use e-commerce for B2B purchases, preferring to stick to traditional shopping methods.
42. C2C E-Commerce Gaining Traction
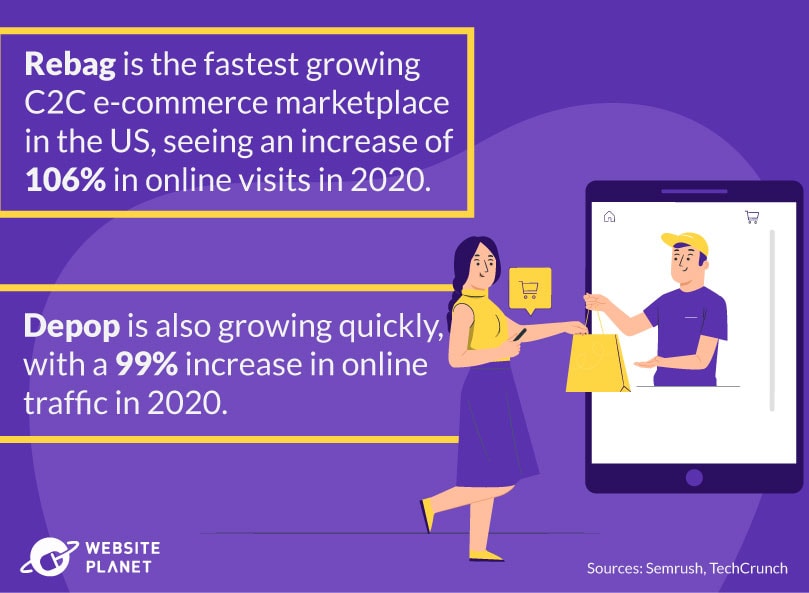
C2C (consumer-to-consumer) marketplaces such as eBay connect consumers with consumers so that they can buy and sell products and services, including used items. The number of C2C marketplaces in the e-commerce space has grown year over year, alongside the sales revenue of these marketplaces.
Rebag has seen the fastest growth of all C2C marketplaces: a 106% increase in visitors in 2020 across the US. The platform — which allows users to buy and sell used luxury bags — saw substantial revenue growth — an estimated 70% increase in sales in 2021 alone.
The fashion marketplace Depop is also among the fastest-growing C2C marketplaces in the US. In 2020, Depop welcomed an increase of 99% in online traffic and saw a 61% increase in the use of its app.
43. Etsy C2C Online Marketplace Growth
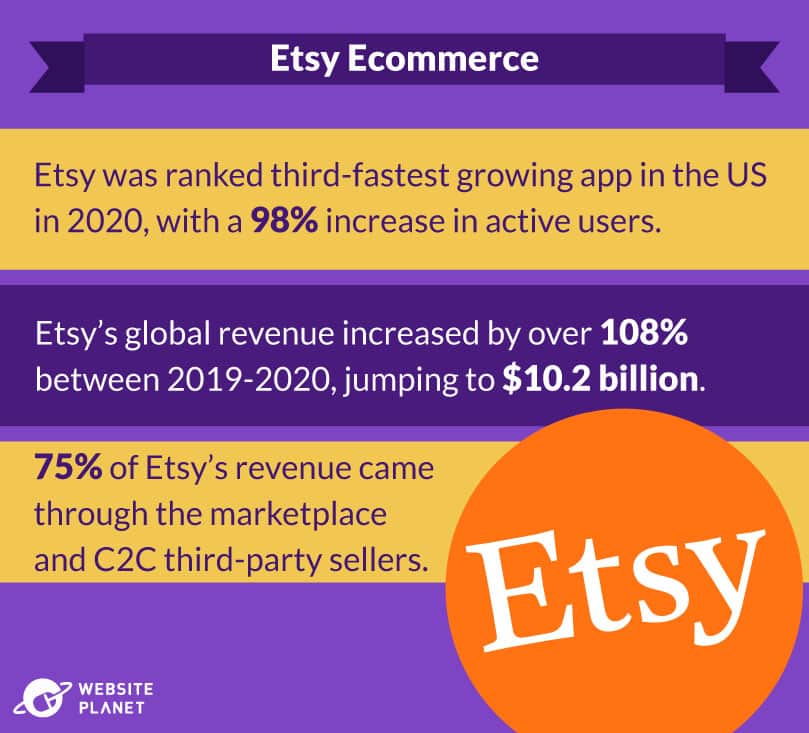
Etsy, a niche marketplace offering mostly handmade and craft items, has boomed in the last decade.
Between 2019 and 2020, Etsy’s gross revenue jumped from $4.9 billion to an impressive $10.2 billion worldwide, equating to an increase of over 108%. A substantial 75% of these sales came from the Etsy marketplace via third-party sellers.
The marketplace has also seen massive growth in the number of active users on its app. In 2020, Etsy was one of the fastest-growing e-commerce apps in the US, with a 98% increase in active users.
The pandemic was one of the greatest influences on this growth, with consumers across the globe spending their free time making or buying handmade items.
44. Third-Party Sellers Lead Amazon E-Commerce
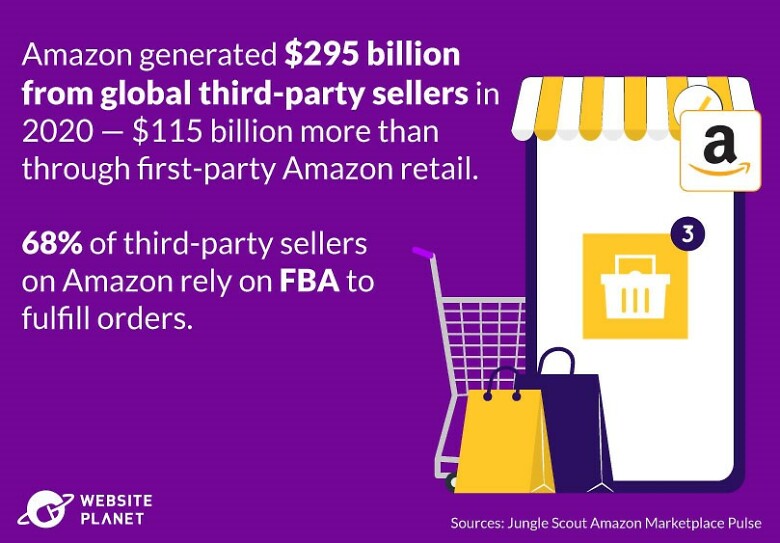
In 2020, Amazon’s worldwide gross merchandise volume reached a record high of $475 billion. More impressive, however, is the amount of revenue generated by Amazon’s third-party sellers, as opposed to Amazon retail.
Third-party sellers are leading Amazon e-commerce, bringing in $295 billion in revenue in 2020. By comparison, first-party sales (via Amazon retail) came in under $200 billion in 2020.
More and more small businesses are turning to Amazon to market their products. Most of these sellers are based in the US, with around 1.1 million active American Amazon marketplace sellers as of 2019. The UK, in second place, had approximately 281,000 sellers.
68% of Amazon’s third-party sellers opt for the Fulfillment By Amazon (FBA) method to complete their orders. This means that sellers manage their inventory without having to store any stock. Amazon is responsible for picking, packing, and shipping the purchased goods to customers.
Online Shopping and Consumer Behavior
Even with the rise of online retail, most of us still like shopping in physical stores, while others only want to buy certain products online. And the majority of us would like to see e-retailers improve in one key area.
45. Consumers Still Prefer In-Store Shopping
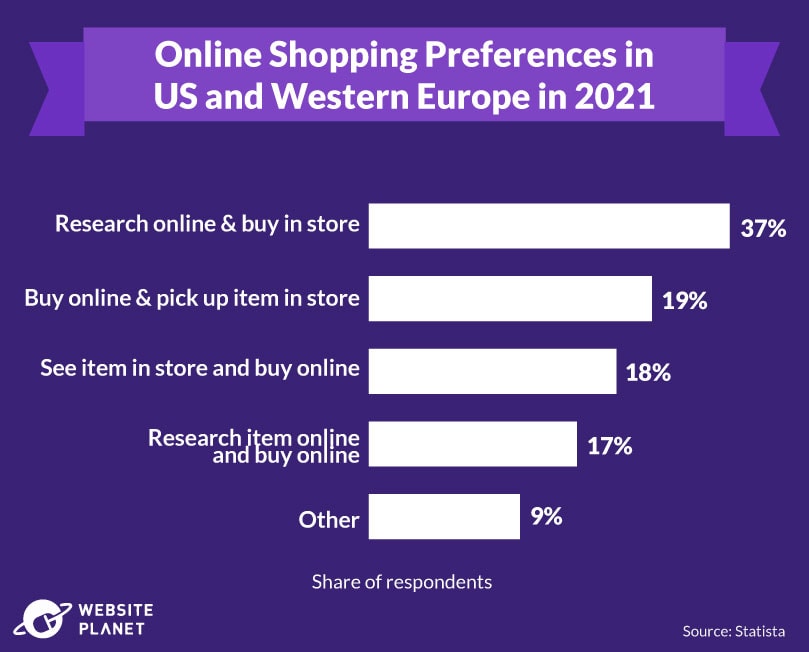
Most consumers in the US and western European countries still prefer to visit a physical store at some point in their buying journey.
A 2021 survey revealed that 37% of consumers turn to e-commerce for researching a product, but still like to head to a physical store to purchase it.
By comparison, only 17% of consumers said they research and buy a product online. And 19% said they are happy to purchase goods online, but still want to visit the store to pick them up.
46. Consumers Are More Likely to Buy Certain Products Online
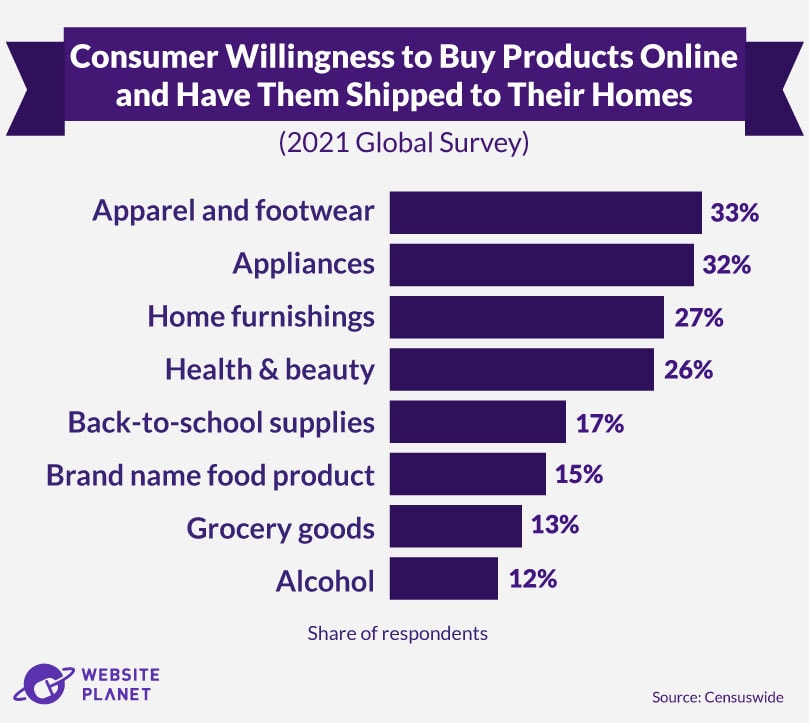
When it comes to buying goods online, consumers are more inclined to purchase apparel and appliances above all else.
In a 2021 global survey, 33% of consumers said they would choose to buy apparel and footwear online and have it shipped to their homes. 32% also said they would opt for this method when buying appliances.
Home furnishings and health and beauty products were among the most frequently purchased online goods, with shipping to home preferred over picking up in-store.
47. Where Consumers Seek Inspiration for Online Purchases
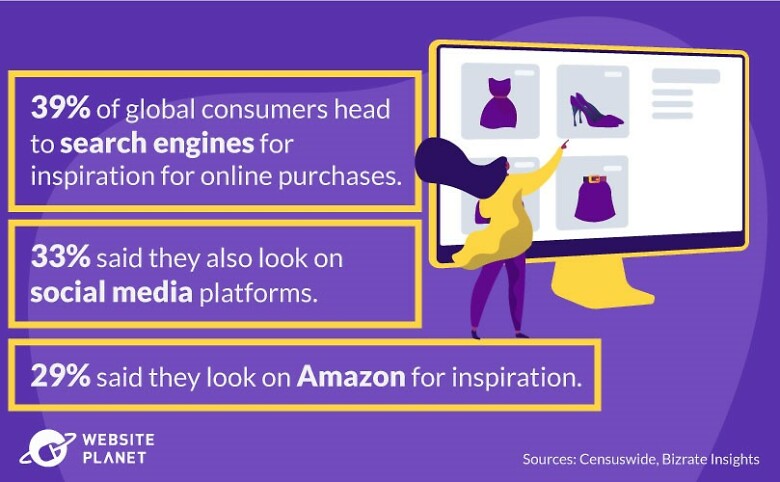
In 2021, search engines were the top source of inspiration for online purchases worldwide. 39% of consumers say they use search engines to do their research when shopping online.
However, marketplaces are another key influence. Nearly a third of consumers said they sought inspiration for purchases on Amazon specifically, while 32% said they look on other marketplaces.
Social media was the second most popular choice for inspiration, with 33% of consumers heading to social networks to find new items to purchase.
Product reviews on social media are critical, too. In another global survey, over 36% of customers stated that they read between 1 and 3 reviews of a product before going ahead with their purchase, and only less than 10% said reviews weren’t part of their consideration.
48. E-Commerce Conversion Rates Have Slowed Down
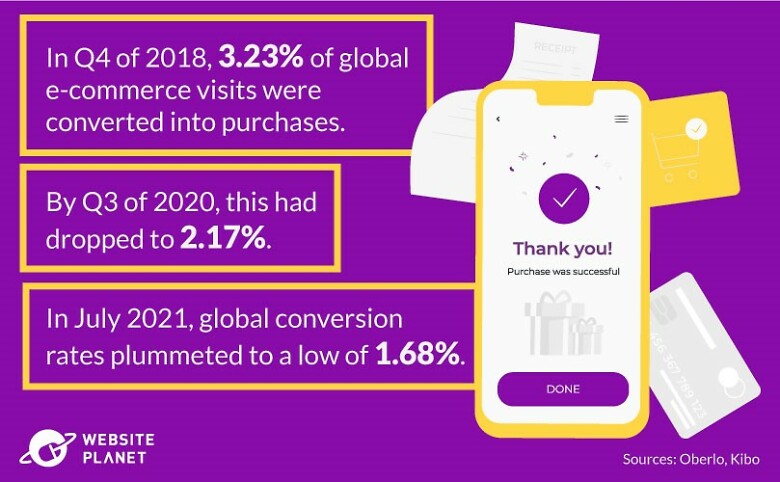
In Q4 of 2018, 3.23% of global e-commerce website visits were converted into purchases. However, by Q3 of 2020, the conversion rate dropped to 2.17%.
In 2021, conversion rates declined even further, plummeting to an all-time low of 1.68% in July. Things gradually picked up again heading into winter, likely due to holiday shopping, though only to 2.42% by November.
49. Cart Abandonment Rates Remain High
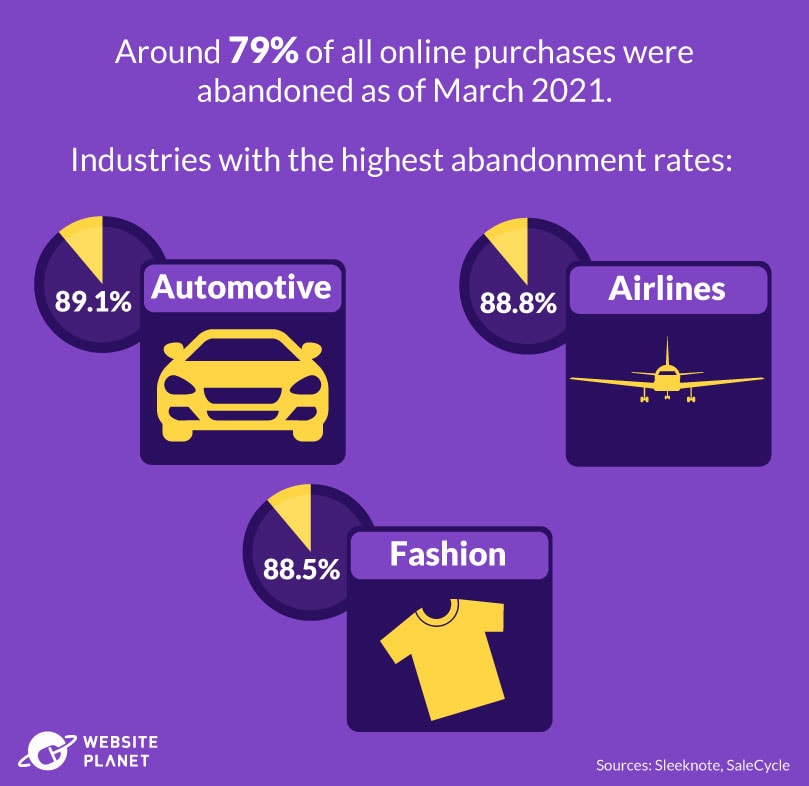
Global cart abandonment rates remain high, with 2021 statistics showing a global average of nearly 80%. That means roughly 8 in every 10 shoppers leave products in their cart without checking out.
These rates vary significantly across industries. As of March 2021, automotive products, airline flights, and fashion-related items were the 3 industries with the highest abandonment rates, each with over 88% of purchases uncompleted.
Interestingly, consumers are also more likely to abandon their carts when shopping on a mobile device. Nearly 86% of orders via mobile are abandoned.
50. High Shipping Costs Stop Consumers from Purchasing Online
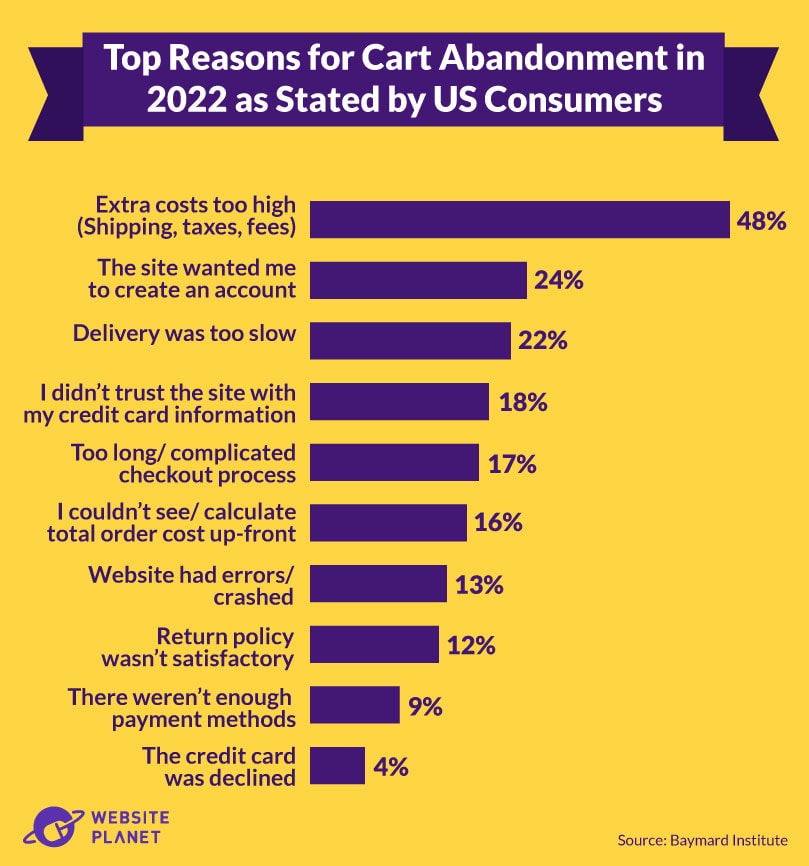
High shipping costs are the most common cause of cart abandonment.
Although consumers may be lured in with low prices and discounts, once they’ve added products to their cart and seen the delivery cost, they’re not so inclined to buy. Around 48% of US consumers stated extra fees (such as shipping and taxes) as their top reason for deciding not to go through with a purchase in 2022.
Consumers also value a smooth checkout experience. Factors such as needing to create an account and website errors were other reasons for cart abandonment. For online markets looking to increase conversion rates, focusing on user experience should be a top priority.
51. Consumers Want Faster Delivery & Free Returns
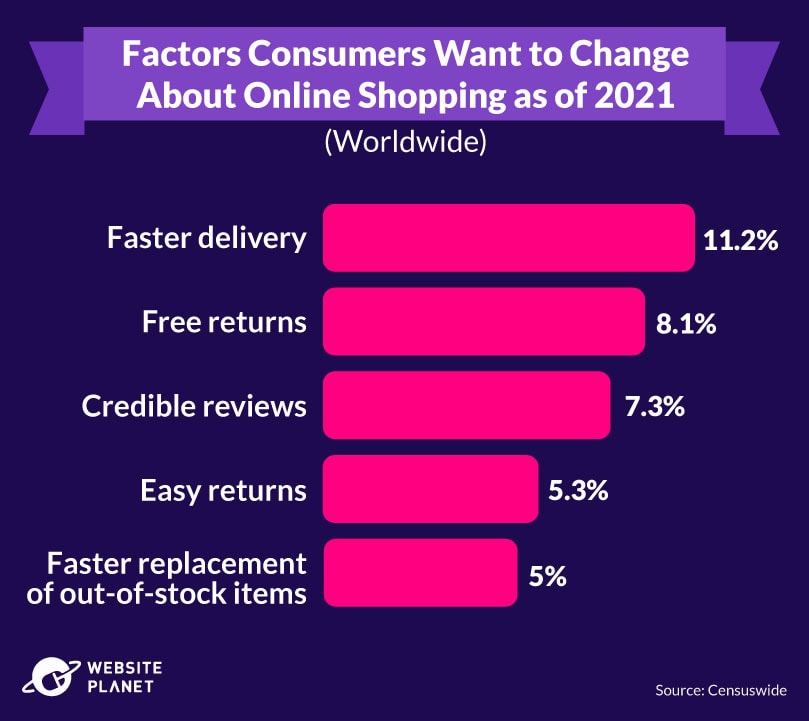
In a 2021 global survey, consumers highlighted that faster delivery and free returns were the top factors they would change about online shopping. Around 11% of people want faster delivery, while approximately 8% of consumers want free returns.
Credible reviews, easier returns, and faster replacement of out-of-stock items were also among the most asked-for features.
52. US Consumers Spend More on PCs
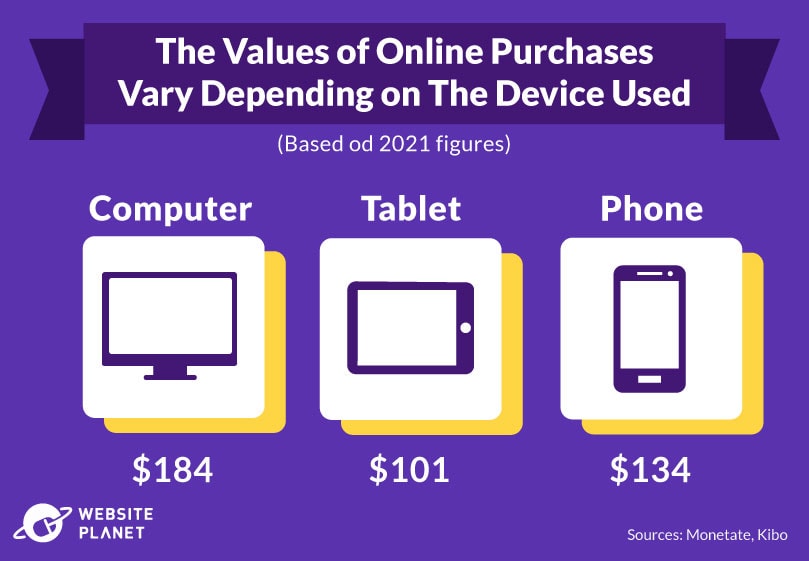
Online shopping trends suggest the amount consumers in the US spend online depends on which type of device they use.
On average, US consumers spend more on their PC than on other devices. In 2021, the average value per order for purchases made on PCs in the US was $184. On smartphones, the total value drops to $134. Tablets rank third, with an average value of $101.
However, globally, e-commerce conversion rates are highest when consumers are shopping on a tablet. Around 3.4% of global e-commerce website visits on tablets converted into purchases in 2020, compared to 2.59% on PCs, and 1.86% on mobile devices.
53. Consumers Prefer Digital Wallets
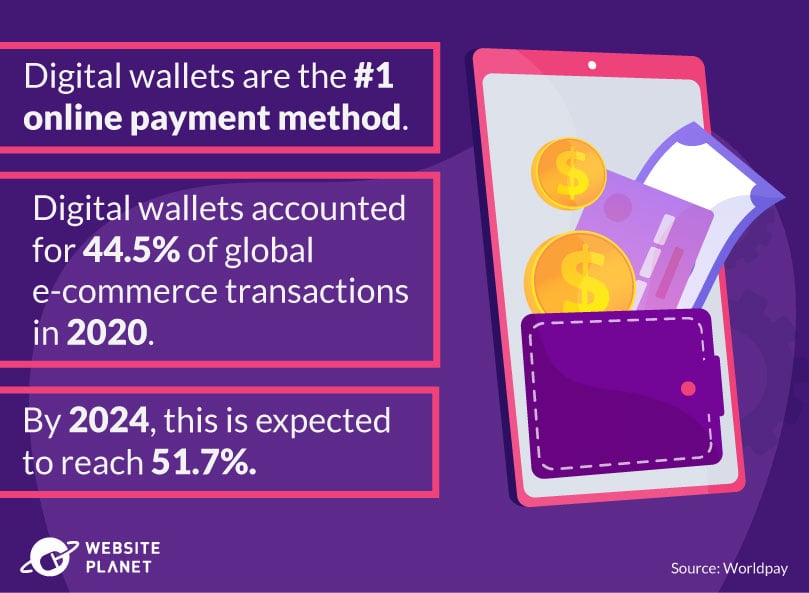
Consumer spending habits show that we use digital wallets more frequently than any other payment method. Ease of use, stored payment details, and faster checkout times have made purchasing online easier than ever.
Digital wallets such as Apple Pay, Google Pay, and PayPal accounted for 44.5% of global e-commerce transactions in 2020. This figure is forecast to increase to 51.7% by 2024.
A significant number of consumers still use credit and debit cards directly. Credit cards are the second most popular payment method, accounting for 20.8% of transactions in 2020 (forecast to rise to 22.8% in 2024).
54. The Rise of Buy Now, Pay Later Schemes
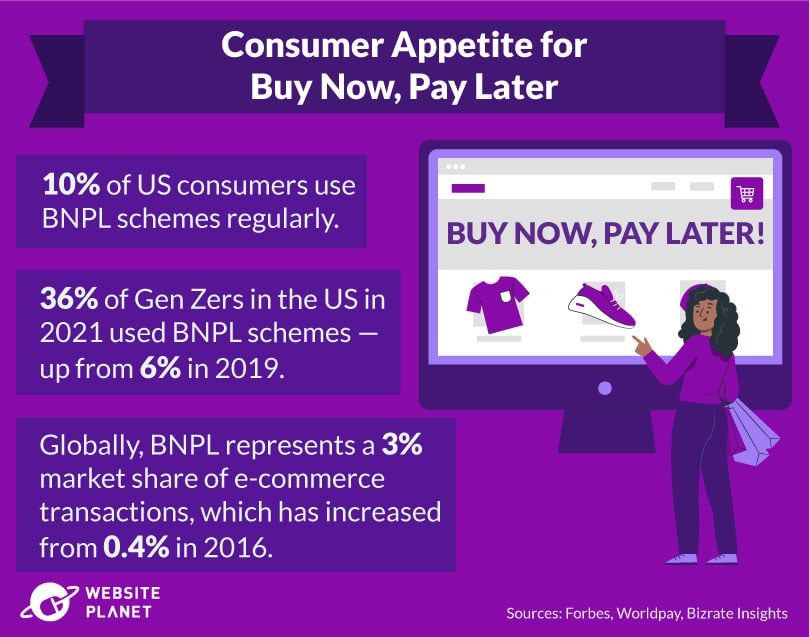
Companies such as Klarna, Affirm, Afterpay, and ClearPay allow consumers to purchase something online, then pay for it later, often in installments. This is known as Buy Now Pay Later (BNPL).
The use of these apps has soared, especially among millennials and Gen Zers. In 2019, around 6% of Gen Zers in the US used BNPL schemes, which increased to 36% in 2021.
Another 2021 survey revealed that at least 10% of people in the US use BNPL schemes “regularly.” 48% said they’re aware of these schemes, though they don’t intend to use them.
Globally, BNPL represents a 2.1% market share in e-commerce payments, increasing year-over-year from 2016 when the market share was just 0.4%. Penetration of BNPL schemes is the highest in European countries, including Sweden, Germany, and Norway.
COVID-19’s Impact on Online Shopping
COVID-19 forced us to change the way we shop. We started buying goods on the internet that we’d normally purchase in-store — and online sales climbed drastically.
55. E-Commerce Soared During COVID-19
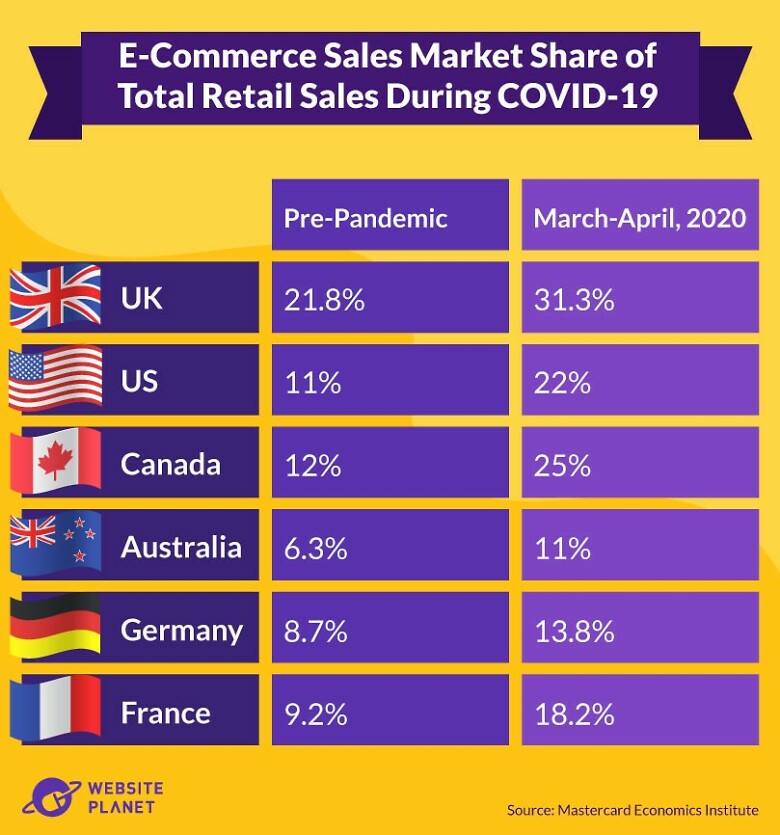
At the height of the pandemic, COVID-19 disrupted the retail landscape — forcing quarantines, closures, and lockdowns — and the global population moved to online shopping.
Around the world, every country saw a dramatic increase in e-commerce sales. In the UK, the share of e-commerce sales out of total retail sales jumped from 21.8% pre-pandemic to 31.3% between March and April 2020.
The US had a similar trend. Pre-pandemic e-commerce sales stood at around 11% of total retail sales, doubling to 22% in the earliest months of the pandemic. Canada saw the biggest increase, with the share of e-commerce market sales rising from 12% to 25% in the spring of 2020.
Global e-commerce sales, as a percent of total retail sales, have fallen, but remain higher than pre-pandemic levels.
56. COVID-19 Transformed E-Commerce Spending Worldwide
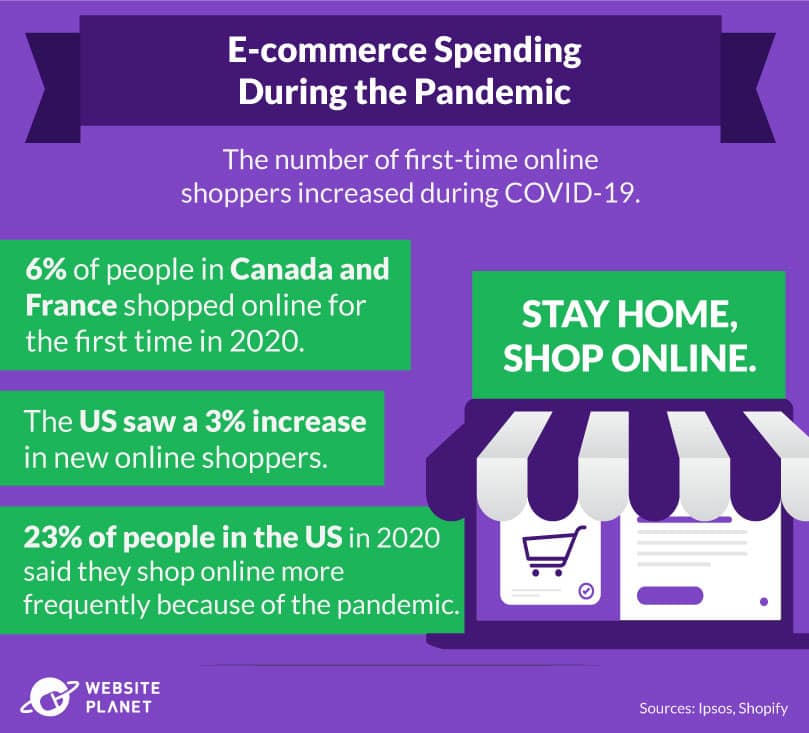
All countries welcomed new online shoppers during the pandemic. In Canada and France, 6% of people shopped online for the first time during COVID-19 (as of 2020). Australia, India, New Zealand, and the UK also saw a 5% increase in new shoppers, while 3% of the US population tried e-commerce for the first time.
As of 2020, 23% of people in the US said they buy goods online more frequently as a result of forced shop closures throughout the pandemic.
The Asia Pacific region saw the highest increase, with 57% of consumers in Vietnam and 50% of consumers in China opting for online stores rather than their brick-and-mortar alternatives.
57. The Pandemic Helped Some E-Commerce Stores Flourish, While Others Struggled
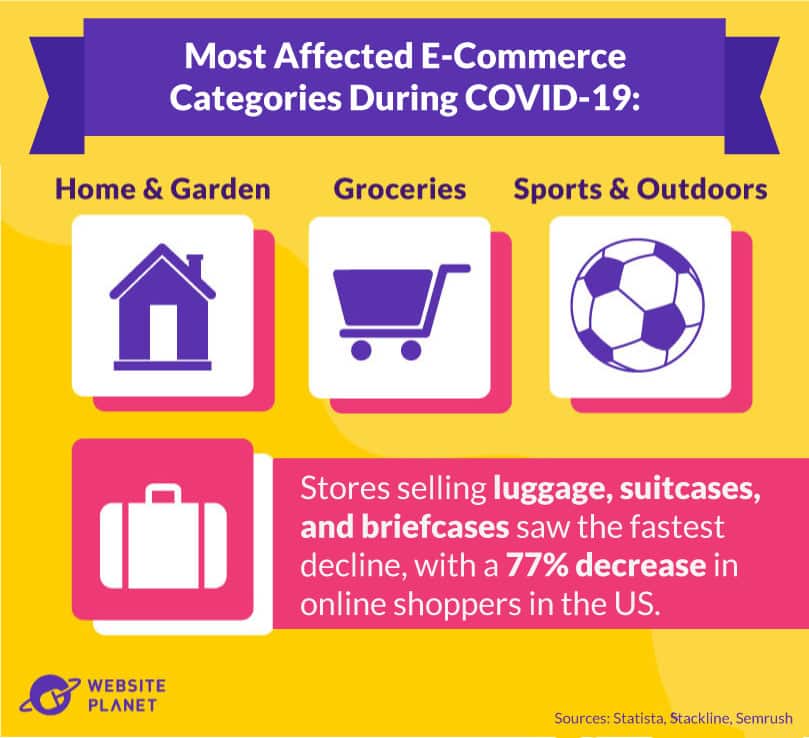
Although the number of online shoppers catapulted during the pandemic, not every e-commerce store had more visitors.
The fastest-growing categories were stores selling home and garden goods, groceries, and sports and outdoor gear. Between February and May 2020, home and garden e-commerce stores saw an additional 69 million visits worldwide, as many took to home improvements while in lockdown.
In the US, 31% of consumers said they ordered deliveries and takeaway from restaurants due to the pandemic, and 24% said they bought food and drinks online.
Other stores, however — particularly those associated with travel — saw a dramatic decrease in online visitors. Retail sites selling luggage were the most affected, with a 77% decline in online shoppers in the US. Men’s and women’s swimwear stores saw a 64% and 59% decline, respectively, reflective of worldwide travel bans and restrictions.
58. Food Delivery E-Commerce Expected to Soar
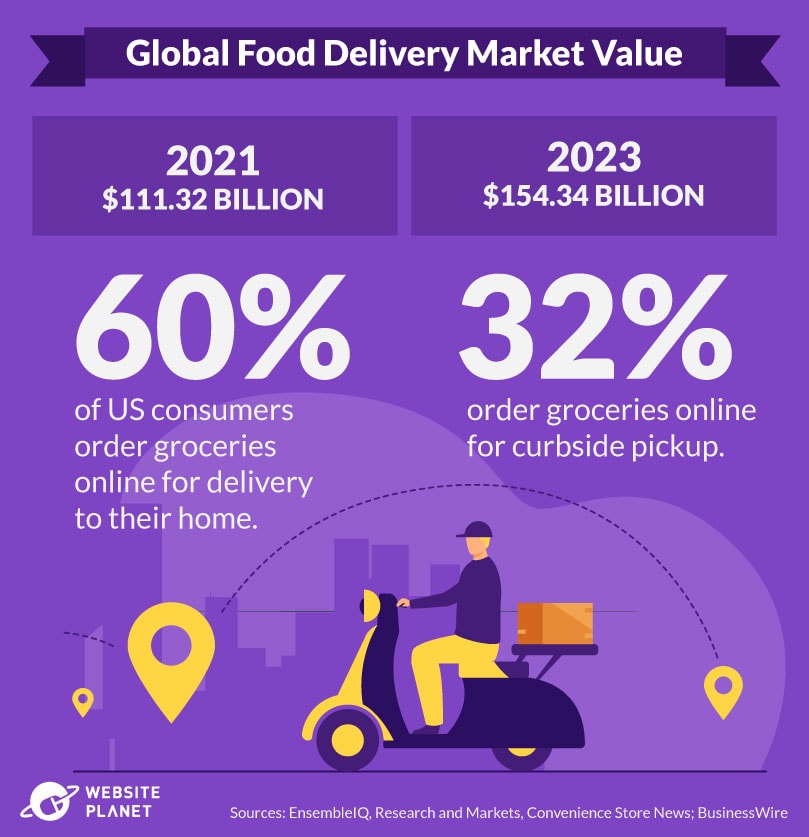
Food delivery saw the fastest growth of all e-commerce categories during the pandemic. And it’s not slowing yet.
In 2021, the global online food delivery market was worth an estimated $111.32 billion. By 2023, this is set to rise to $154.34 billion, as more consumers turn to food delivery apps and online grocery orders.
A 2021 survey found that most US consumers opt to do their weekly grocery shopping online. Approximately 60% of consumers buy groceries online for home delivery. 32% buy groceries online for curbside pickup — a service many restaurants and grocery stores tried for the first time during the pandemic.
37% of consumers said they would continue to use Amazon and Amazon Fresh for grocery orders even after Covid passes or becomes endemic.
59. US Consumers Are Trying New Digital Shopping Methods
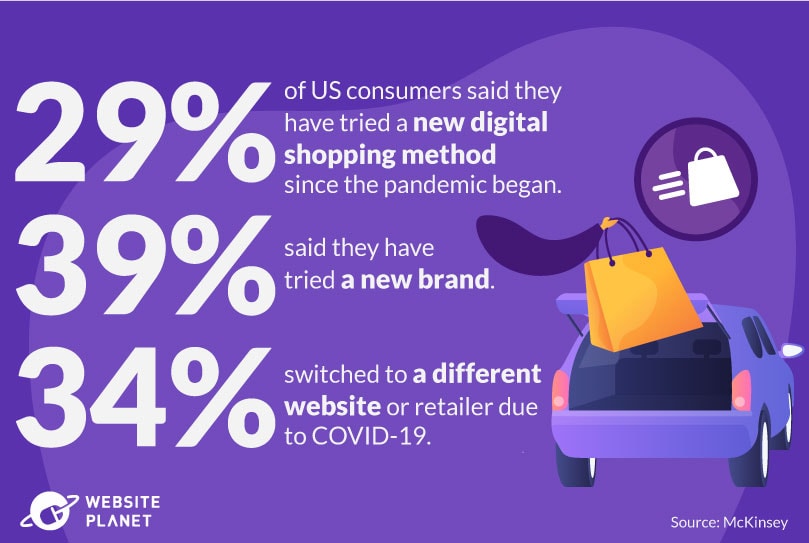
In a US survey, 29% of people said they had tried a new digital shopping method since the pandemic began. These methods include buying online with home delivery, in-store pick-up, and curbside pick-up.
However, 39% said they tried different brands while shopping online, and 34% switched to new retailers – showing that e-commerce is more competitive than ever.
60. COVID-19 Made Fast Delivery & Availability More Important
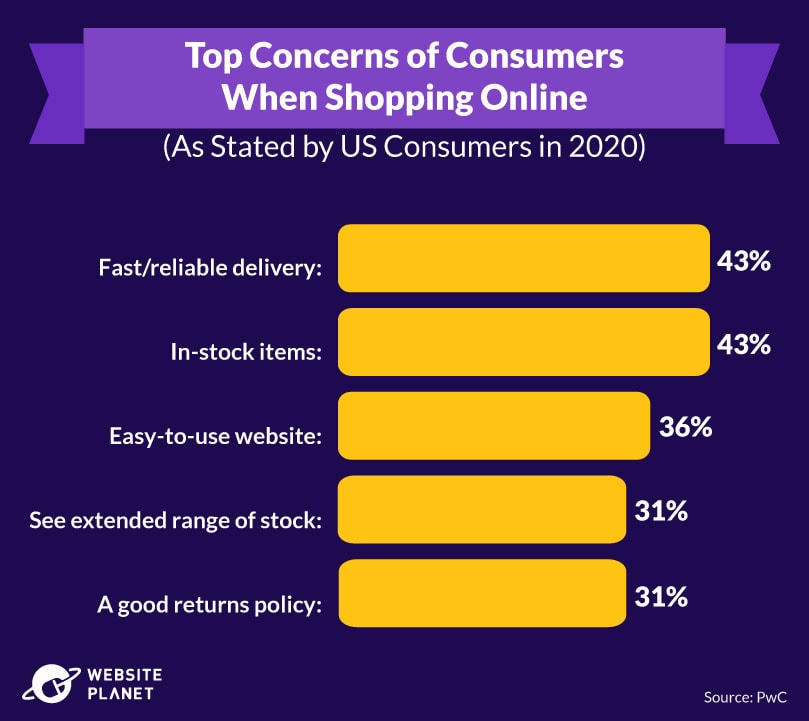
Lockdown measures were influential when it came to what we value from e-commerce. Without the ability to shop in-store and take goods home immediately, consumers were most concerned about the availability of their favorite products and how fast they could get them.
In particular, 43% of US consumers said that fast and reliable delivery were among the most important factors when shopping online in 2020. 43% also listed the availability of the items they wanted as a critical concern.
The other top factors affecting online orders are:
- easy-to-use website
- ability to browse other in-stock items
- a good return policy
E-commerce stores must make changes to satisfy these consumer concerns if they’re to survive post-pandemic.
61. Live Shopping & Virtual Assistants Helped E-Commerce Sales During COVID-19
During the pandemic, e-commerce stores tried new methods to replicate the in-store shopping experience and attract shoppers. Approaches included live shopping, virtual assistants, virtual try-on, and product samples.
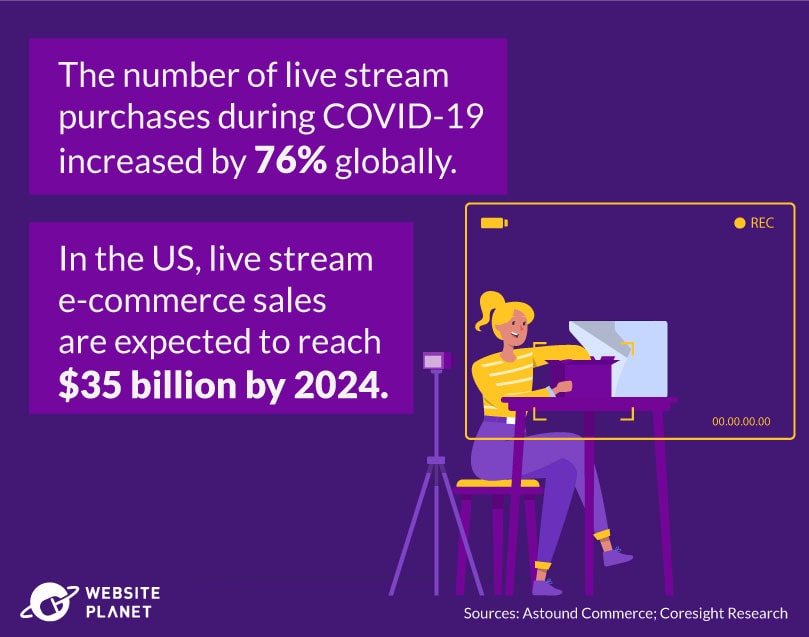
The number of purchases made via live streams surged during the worst of the pandemic, with a 76% increase in live stream purchases globally. In the US, live stream sales reached $6 billion in 2020 and $11 billion in 2021.
By 2024, live stream sales are expected to soar to $35 billion, with more consumers opting for shopping from the comfort of their homes over in-store browsing sessions.
62. E-Commerce Shopping Habits Post-Pandemic
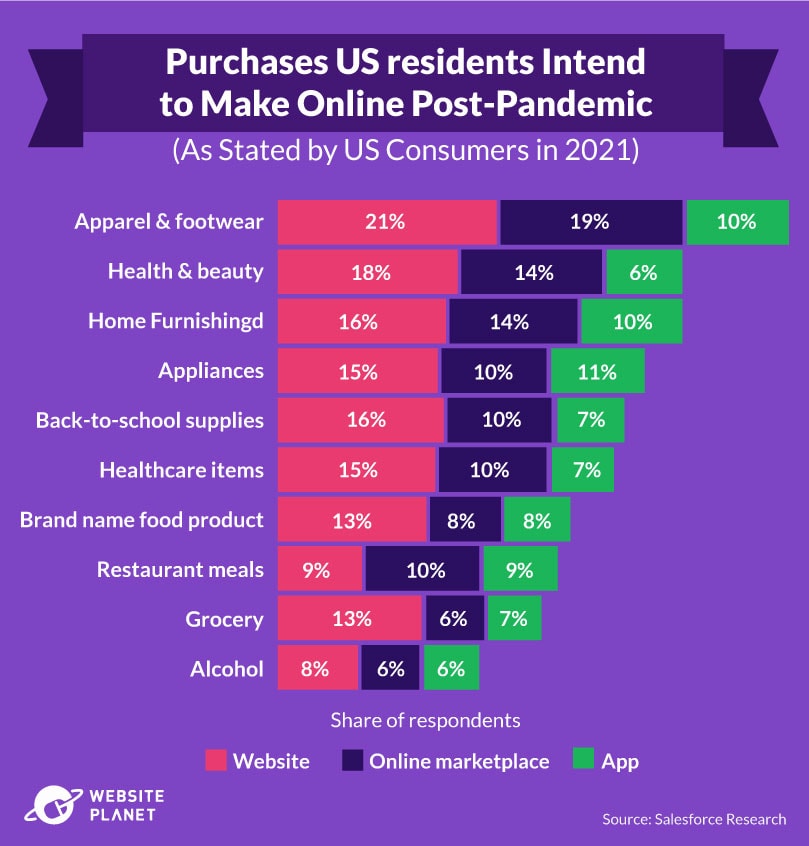
Many of the changes we’ve made during COVID continue even during lulls between outbreaks, when the world can open up. In the US, even with most physical stores back open, people are still shopping online via brand websites, online marketplaces, and apps.
When they consider their post-pandemic habits, apparel and footwear is the category where US consumers intend to spend the most online. In a survey taken in mid-2021, fully 50% of respondents intended to continue shopping online through websites (21%), online marketplaces (19%), and apps (10%).
Health and beauty and home furnishings also ranked highly. 40% of respondents said they will continue to browse for these products via websites, online marketplaces, and apps.
63. More Consumers Are Becoming Mindful of Spending
The results of the pandemic have forced many people to keep a closer eye on their budgets. More consumers are becoming conscious of their spending habits, which could have a domino effect on the e-commerce market.
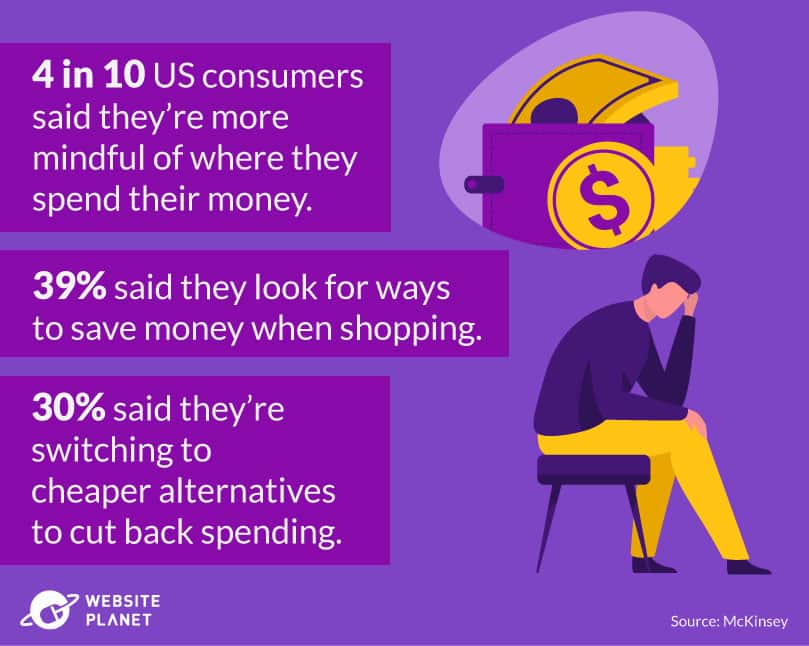
In one survey, taken in November of 2020, 4 in 10 US consumers said they are now more mindful of where they spend their money. 39% said they look for ways to save money while shopping, and 30% said they’re switching to cheaper alternatives to cut back.
The Impact of Online Shopping
E-retailers are busy, production of goods is growing, the number of deliveries is climbing, and the environment is suffering the consequences. But online shopping is also leaving a lasting impact elsewhere, including the decline of physical stores and increased online scams.
64. Online Shopping Is Forcing the Closure of Department Stores
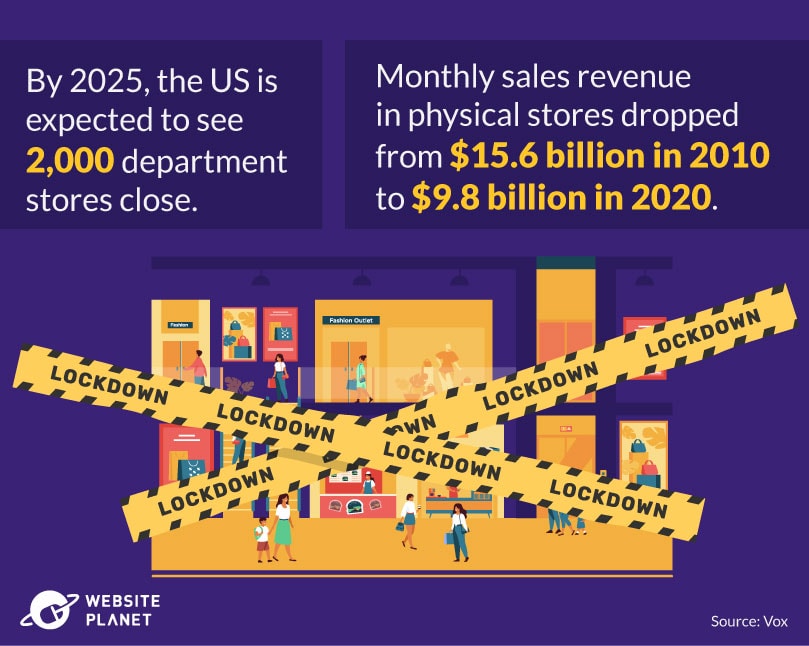
As online shopping grows, department stores worldwide are closing down, due to less foot traffic and a massive reduction in sales.
In the US, for example, monthly department store revenues have been declining for years, from an average of $15.6 billion in monthly sales in 2010 to just $9.8 billion in 2020.
The US currently has around 6,000 department stores, but over the next 3 years, 2,000 are forecasted to shut their doors.
65. Spending In-Store Is Steadily Declining
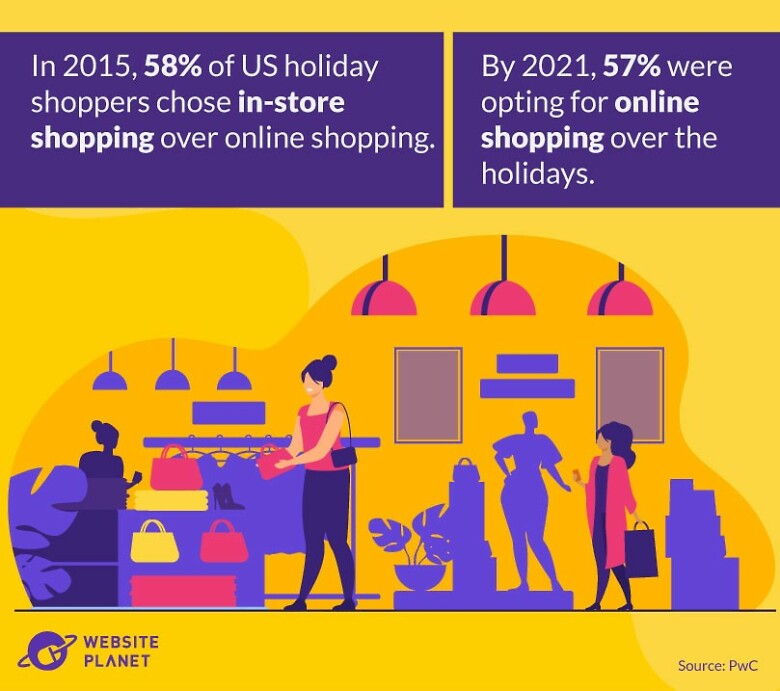
The number of people shopping in physical stores has been steadily declining for years.
Back in 2015 and 2016, 58% of consumers chose to shop in-store rather than online.
Over the 2021 holiday period in the US, 57% of US consumers opted for shopping online, compared to 43% in physical stores.
66. E-Commerce Leaves a Lasting Effect on the Environment
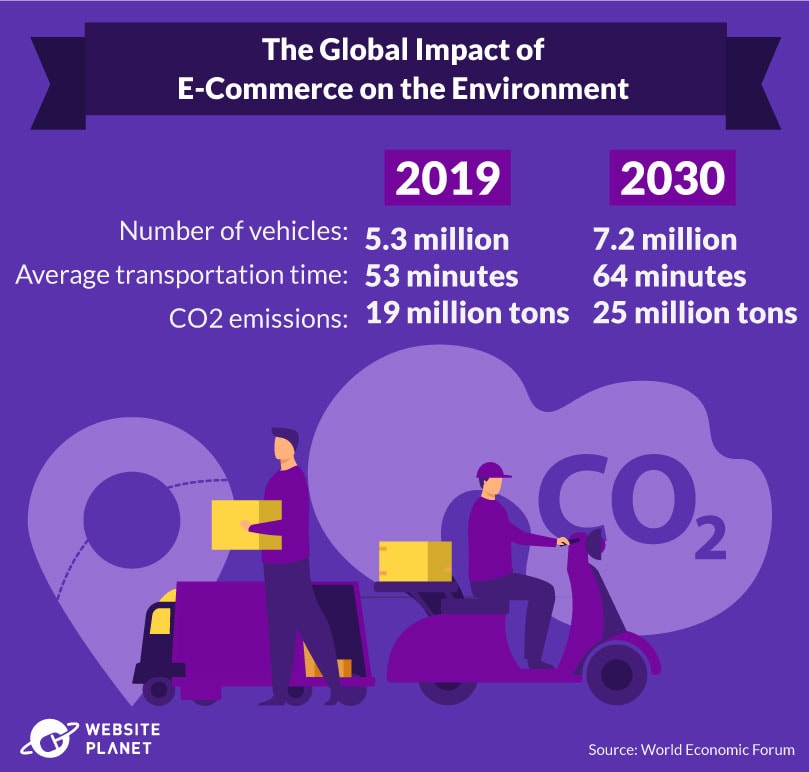
The environmental damage of e-commerce is increasing at a worrying rate.
For example, more transport vehicles are on the road, leading to more emissions. This is estimated to rise to 7.2 million by 2030.
With the average commute time also expected to increase from 53 minutes to 64 minutes, delivery vehicles will be on the road for much longer overall. The e-commerce sector is under growing pressure to reduce its carbon footprint.
In 2019, the e-commerce sector emitted around 19 million tons of CO2. By 2030, this is expected to increase to 25 million tons. In fact, shipping and road transport account for 10% and 30% of all greenhouse gas emissions worldwide, respectively.
67. E-Commerce Plastic Packaging Waste Is a Problem

Packaging is another huge contributor to greenhouse gas emissions. Of all global greenhouse gasses produced by e-commerce retailers, emissions from packaging account for 45%.
Plastic, in particular, leads to packaging waste and is a massive cause of pollution worldwide. China and the US are the biggest producers of e-commerce plastic waste. In 2019, China produced 221.5 million kilograms of plastic waste, while the US was responsible for 212.7 million kilograms.
68. E-Commerce Returns Adding to Landfills
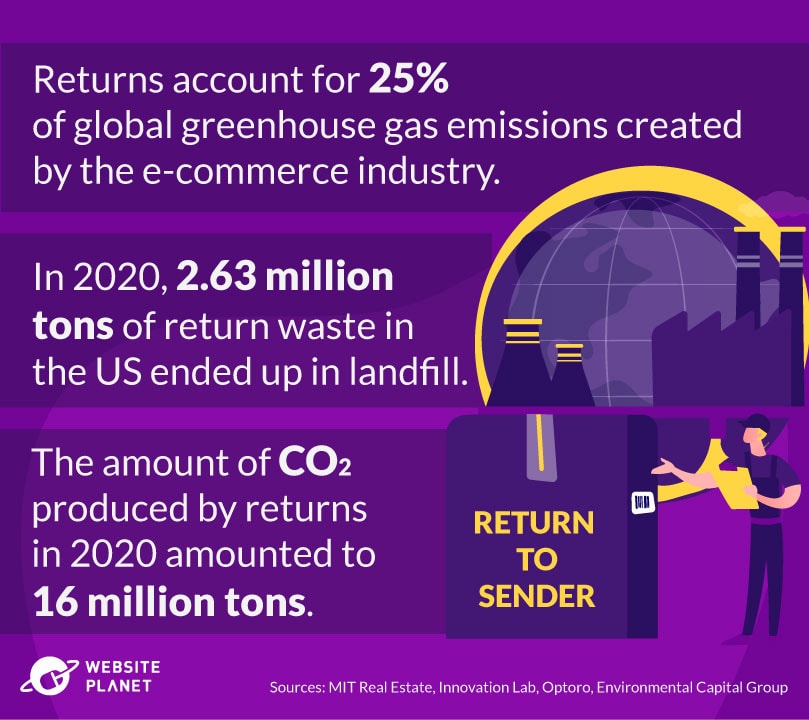
As the second-biggest emitter of greenhouse gasses in the e-commerce sector, returns are a developing environmental issue. They account for an estimated 25% of global e-commerce greenhouse gas emissions.
The majority of these returns end up in landfills. In 2020, stores in the US sent approximately 2.63 million tons of returned goods to landfills – almost 16% higher than 2019. The production of CO2 as a result also increased, reaching 16 million tons alone in 2020.
69. Fashion Creates the Highest Emissions in E-Commerce
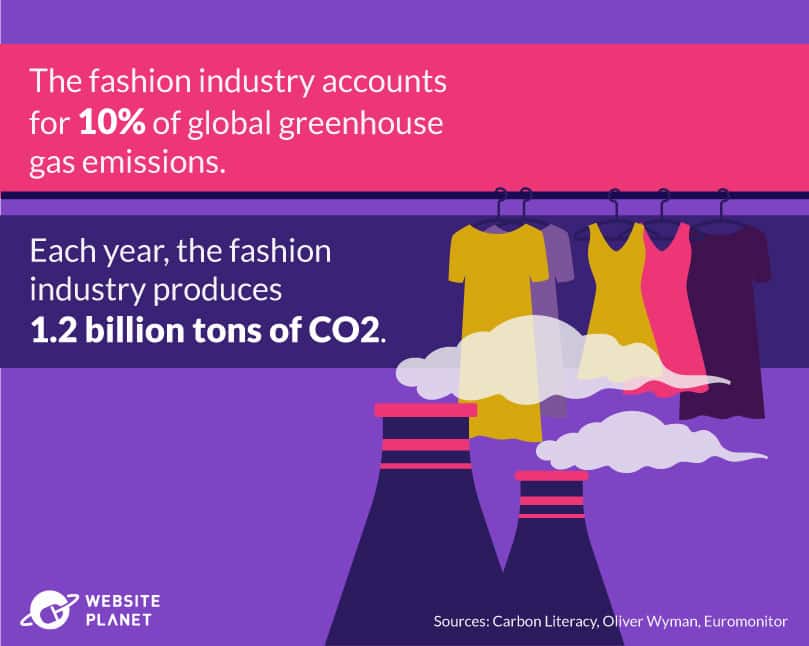
Outside of food-related emissions, fashion items are the biggest producers of CO2 across Europe.
In the UK, for example, the online purchase of fashion items produced, on average, 854 grams of CO2 in 2019. The figure is significantly higher in Spain, with an estimated 1,166 grams of CO2 per item.
Overall, from manufacture to landfill, fashion accounts for 10% of global greenhouse gas emissions, which is more than the travel industry produces. Each year, the fashion industry releases around 1.2 billion tons of CO2 into the atmosphere.
70. Consumers Want Environmentally Friendly Packaging
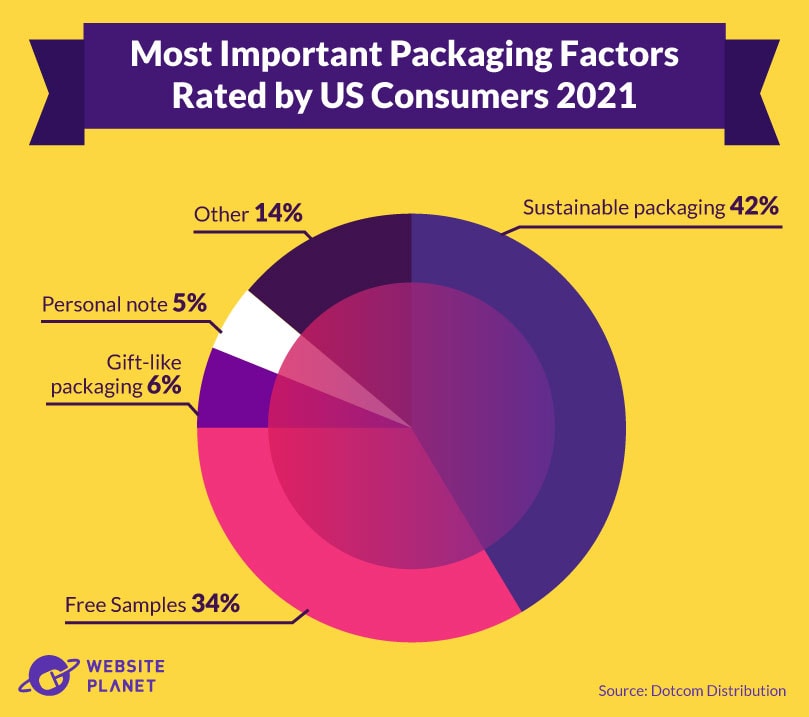
In 2021, 42% of US consumers surveyed said that sustainability was the most important factor related to packaging. It ranked higher than other key components such as personal notes, gift-like packaging, and free samples.
E-commerce retailers who want to appeal to their market should offer eco-friendly packaging!
71. Consumers Want More Sustainability From E-Retailers
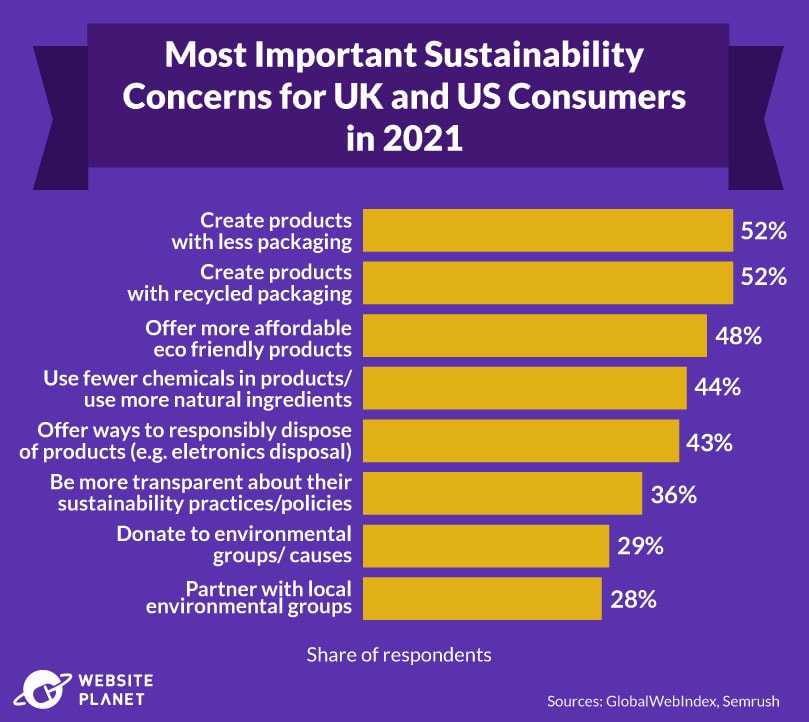
Across the board, consumers want more sustainability from e-commerce retailers to reduce their impact on the environment.
In 2020, “Impact of online shopping on the environment” was the most searched sustainability-related query worldwide, with a year-over-year increase of nearly 2,000% in online searches.
A 2021 survey showed that 52% of US and UK consumers want e-commerce stores to create products with less packaging, and more recycled materials. But packaging isn’t the only concern.
48% of consumers said they want the actual products that online stores sell to be more eco-friendly overall. Another 44% of people said they wanted fewer chemicals and more natural ingredients in the products they buy online.
Giving advice on ways to responsibly dispose of products, being transparent about sustainability policies, donating to environmental groups and causes, and partnering with local environmental groups were some of the other top sustainability concerns.
72. E-Commerce Retailers Are Taking Action Toward Environmental Challenges
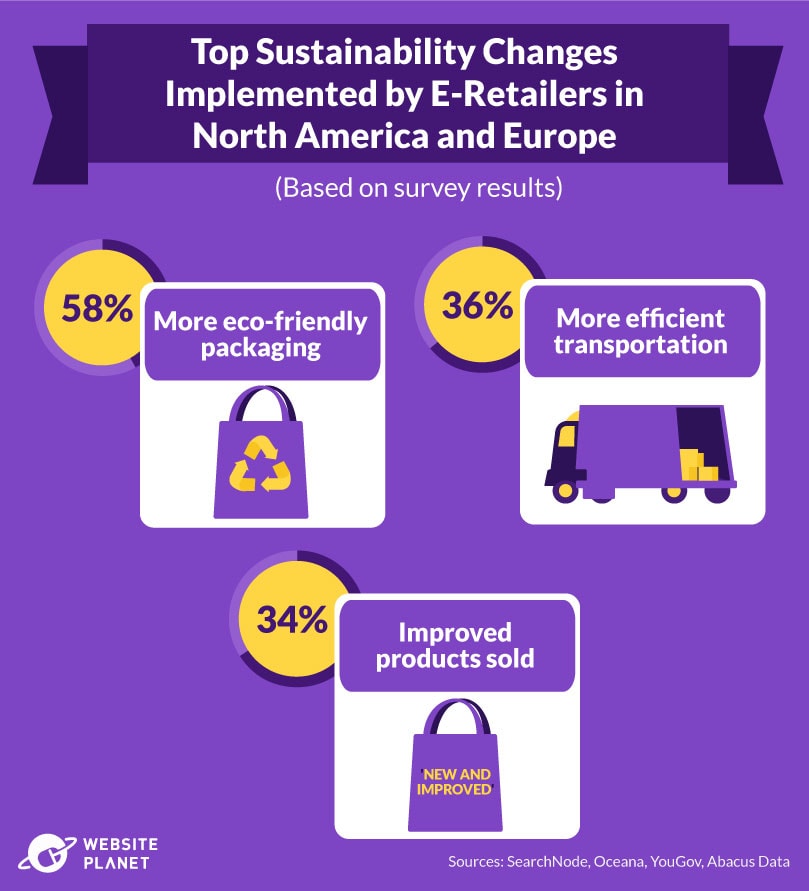
Many e-commerce retailers are well aware of the impact online shopping has on the environment. Thankfully, online stores are beginning to take action toward reducing their carbon footprint.
In 2020 across North America and Europe, the majority of e-retailers (58%) said they had begun at least offering improved packaging that is more eco-friendly. The second most common sustainability practice adopted by e-retailers was improving transport efficiency to cut emissions. 36% of e-commerce stores are making this change.
However, these changes don’t necessarily mean that consumers believe enough is being done.
In a survey of Amazon customers in the US, UK, and Canada, 92% said they were disappointed that most packaging either can’t be recycled, or has so little value in the recycling market that it’s not worth doing.
https://www.forbes.com/sites/davidrvetter/2020/12/15/this-is-how-much-plastic-from-amazon-deliveries-ends-up-in-the-ocean/?sh=f99147e63b49
While companies are making efforts toward greater sustainability, there’s more work to be done.
73. Online Purchase Scams Remain Prevalent
The impact of online shopping isn’t only related to closed physical stores and environmental damage. On top of these unintended consequences, consumers are also suffering from the ill intentions of bad actors.
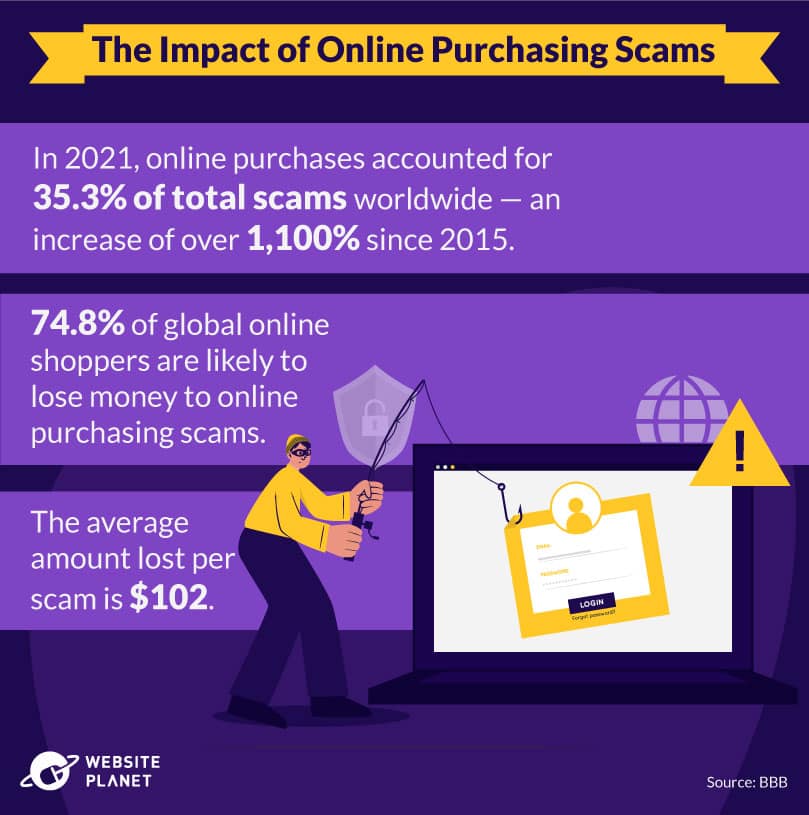
In 2021, online purchases accounted for 35.3% of total scams worldwide, which has been steadily increasing for years.
Since 2015, online purchasing scams have risen by a staggering 1,100% worldwide. In 2015, only 2.8% of scams related to online purchases, jumping to 24.3% in 2019.
In 2021, an estimated 74.8% of global online shoppers were likely to lose money to online purchasing scams, with the average loss being $102.
The Future of Online Shopping
What will online shopping look like in the future? The rise of technology is changing how we shop online, offering more personalized purchasing experiences, better customer targeting, and life-like virtual shopping methods.
74. Artificial Intelligence Will Predict Consumer Trends
Predicting buyer patterns is essential for reaching consumers and offering the products they want before they even know they want them.
For e-commerce retailers to stay ahead and remain competitive, they must find ways to break through the noise and capture their target consumers’ minds (and wallets). One way to do that is through artificial intelligence (AI).
Retailers must prepare to forecast consumer trends using automated tools. These tools will assist online stores in locating and connecting with their target consumers, collecting data, and analyzing browsing habits to precisely anticipate forthcoming consumer interests.
75. The Consumer Experience Will Become Even More Personal
AI will also allow e-retailers to make the buying experience more personal than it’s ever been.
Through machine learning, AI will optimize the online shopping experience by studying purchasing history, browsing habits, search queries, and other important metadata. With this information, stores will better target consumers through product recommendations, chatbot services, and automatic emails.
76. Augmented Reality Will Shape Online Purchases
The future of e-commerce means that window shopping won’t only take place in the physical sense.
Augmented reality will allow consumers to virtually try on items, look at products in 360°, and interact with retailers directly, all while engaging in an overall more fun shopping experience.
In one survey, 31% of consumers said they would be interested in Augmented Reality (AR) for buying products, especially because they can have a 360° visualization of a product.
77. Social Selling Will Continue to Climb
If e-commerce retailers don’t make the most of social selling in the future, they risk being left behind.
The use of social media for online shopping will continue to grow, as more platforms offer in-app purchasing methods. More sales will come from other social media platforms, such as Pinterest, with visual searches of recommended products based on the image a consumer is looking at.
Shoppable videos via social media will also allow e-commerce stores to advertise their products and connect with consumers in new ways. Stores could also personalize these videos to individual consumers’ search queries and browsing habits. On YouTube, which offers ad personalization, 63% of consumers say they’ve bought from a brand after seeing it on the video platform.
78. E-Commerce Will Move to Mobile
Recent trends show online shoppers stepping away from PCs and turning to mobile devices.
Although more transactions currently take place on PCs, we’ll likely see habits change as websites become more mobile-friendly. Push notifications, digital mobile wallets, and easy in-app purchases are making the mobile consumer shopping experience more seamless than browsing via a website on a PC.
Sales via smartphones are expected to soar to $432 billion by the end of 2022, making it more critical than ever that online stores adapt to mobile platforms.
The Bottom Line
Our ever-growing digital landscape means that e-commerce retailers are everywhere. They’re in your email inbox, on your social media platforms, sending you push notifications on your phone, and even serving you personalized ads while you’re watching videos.
No wonder the number of online shoppers is increasing so fast. More of us are heading to e-commerce stores and opting to shop online rather than in-store — even if we’re in the store itself.
But online shopping isn’t perfect. Consumers are waking up to the environmental impact, especially the tons of greenhouse gasses being emitted into the atmosphere and the harmful single-use plastic packaging that comes with our online orders.
Thankfully, the future of online shopping looks set to become more sustainable. It’s also going to become more technology-driven and busier than ever, as we shop whenever and wherever we are.
So, what’s next on your shopping list? *adds to basket*


