If you’re a Caucasian male, you’ve won the lottery when it comes to getting hired in tech, or so it seems. According to tech diversity reports, in the biggest tech companies, men represent between 77% and 88% of the workforce, and Caucasians between 40% and 51%.
Those figures seem to reveal a stark truth: if you’re a woman or a person of color, it’s much harder to get a tech job. In the past, recruiters have subtly discouraged women from applying to tech jobs. Plus, a LinkedIn study shows that even when women apply, recruiters are less likely to pick up their resumes or interview them. It’s a similar situation for people of color.
But does that still apply if you’re going for a mid-level position at a tech firm? Here at Website Planet, we wanted to test this for ourselves. Read on to learn how we ran our test, what we discovered, and how companies can do better with inclusive hiring practices.
Our Research Hypothesis
Our research hypothesis was simple. Given the takeaways from previous studies, we expected to find that:
- Caucasian males would get more positive responses than any other group when applying for mid-level tech jobs.
- Caucasians, in general, would get more positive responses than any other ethnicity.
We ran our tests in three different cities:
- Washington D.C. area
- Boston/Cambridge, Massachusetts
- Omaha, Nebraska
Since the first two cities are often described as “liberal” (and, therefore, presumably more likely to hire women or people of color), we also included a predominantly conservative city.
We created six fictional CVs for six people, a male and female from each of three ethnic groups: Caucasian, African American, and Latino.
Each CV had the same level of education and employment background. But the names were different, and each CV included an image of the applicant, so his or her ethnicity was evident.
This process allowed the Website Planet researchers to measure both gender and ethnic differences in the responses received. There was also a phone number and email address on each CV, so we could easily track phone and email responses.
At the same time, we researched 100 tech jobs per city to send the CVs to, including junior and senior developer, web designer, administrator, and product manager roles.
We applied within three days of each job listing, sending the six CVs out to each open opportunity, then waited three weeks so we could monitor results. For each application, we tracked both positive and negative responses, and both email and phone communications.
The Results
So, were our hypotheses correct? Here’s what we learned:
Hypothesis #1 – FALSE – Caucasian Women Win the Hiring Game
We thought Caucasian men would get more positive responses than any other group, but we were wrong.
In Washington, D.C., out of 100 applications, the Caucasian woman got the most calls (nine) and positive responses (22) compared to other ethnic groups. The Latina woman was the next most successful, getting eight calls and 11 positive responses. The African American woman, African American man, and Caucasian man all got 11 positive responses each, though the African American woman got 5 calls, while African American and Caucasian men only got 4. The Latino man had the worst results, with only 5 positive responses, including four phone calls.
There was a similar pattern in Boston/Cambridge. Again, the Caucasian woman received the most calls (8) and the most positive replies (23). The Latina woman got the second-best results again, with 7 calls and 20 positive responses. The African American man and African American woman both got just 3 calls and 15 positive replies each. The Latino man was the worst off again. Though he got 16 positive replies, including 5 phone calls, he also had the highest number of negative responses (17).
In the more conservative area of Omaha, Nebraska, there was a different pattern. The African American woman got the most positive responses (22), followed by the Caucasian man (19) and Caucasian womaen (18). While the African American man got a reasonable number of positive responses (15), no African American man got a phone call. Meanwhile, the Causasian man received 9 phone calls. And again, the Latino man got the most negative responses (21).
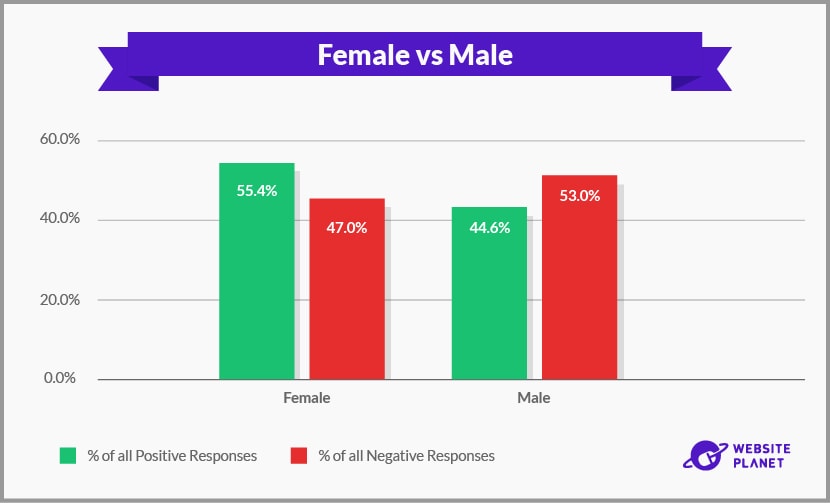
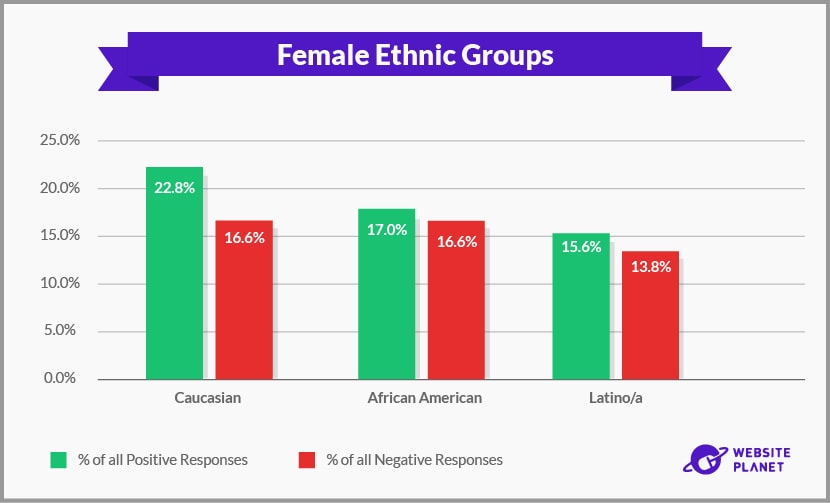
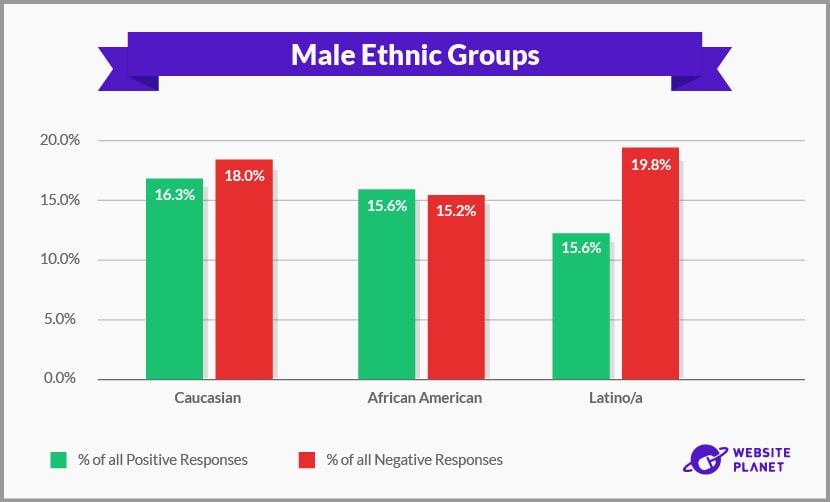
Overall, our applications got 276 positive responses and 217 negative responses. Within that total, women got 55.4% of the positive responses, while men got 44.6%. Women had 47% of the negative responses, while men had 53%. Caucasian women had the biggest share of positive responses, at 22.8%, while Latino men had the lowest share, at 12.7%. Latino men also had the highest share of negative responses (19.8%), and Latina women had the lowest (13.8%).
Hypothesis #2 – TRUE – Overall, Caucasians Get the Most Positive Responses
When looking at the overall results for both male and female applicants of different ethnicities, our original hypothesis was correct. Caucasians got the highest number of positive responses to their CVs, racking up 108 responses compared to 90 for African American candidates and 78 for Latino candidates. The range of negative responses was much more closely packed. Caucasians had 75, compared to 73 for Latinos, and 69 for African American candidates.
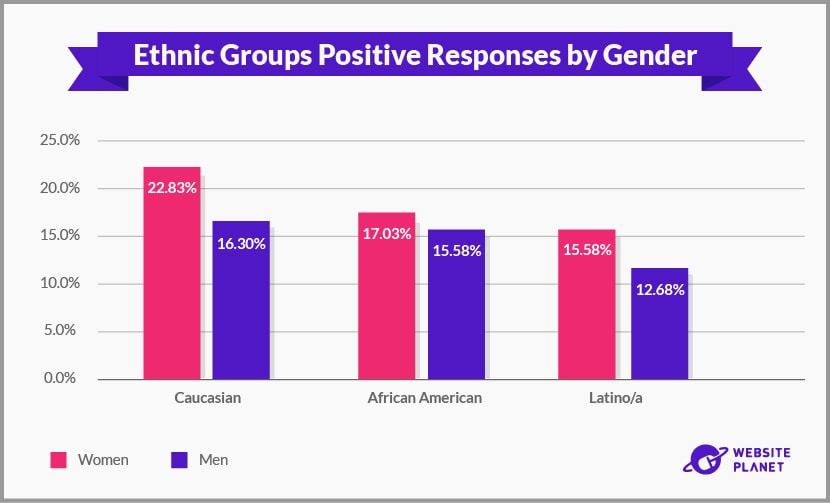
While Caucasians saw the best overall results compared to other ethnicities, there was still a gender divide. Caucasian women saw 22.83% of positive responses compared to 16.3% for Caucasian men. African American women got 17.03% of positive responses, compared to 15.58% for African American men. And Latina women got 15.58% of positive responses, compared to 12.68% for Latino men.
Other Findings
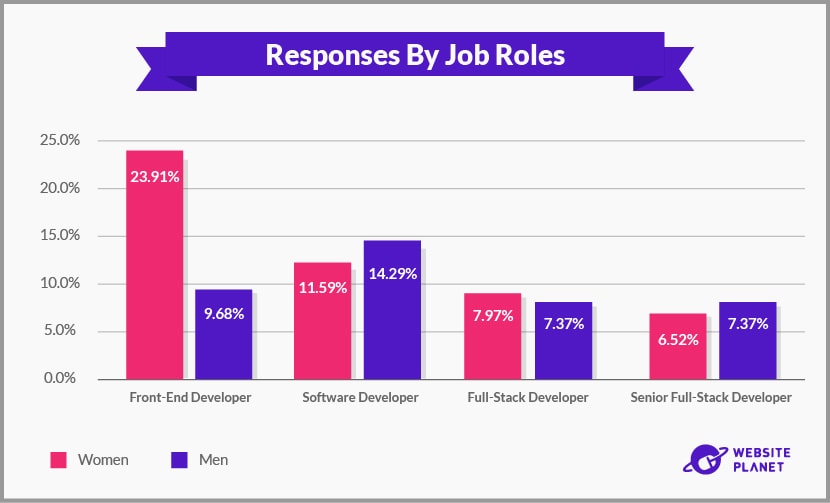
There was another interesting finding from the research. Four job roles got the most responses, both positive and negative, suggesting that these skills are in high demand.
The job roles that got the most positive responses were:
- Front-end developer – 23.91%
- Software developer – 11.59%
- Full-stack developer – 7.97%
- Senior full-stack developer – 6.52%
Those that got the most negative responses were:
- Software developer – 14.29%
- Front-end developer – 9.68%
- Full-stack developer – 7.37%
- Senior-full stack developer – 7.37%
It’s interesting that the software developer role attracted the most negative responses. This could suggest that recruiters are more discerning about hiring the right developer for their needs.
What Can We Learn from This?
It’s surprising that Website Planet’s research contradicts some of the other research out there about hiring in tech. Our data shows that it’s easier than you’d expect for women to get hired for mid-level tech jobs. Although of course, this doesn’t mean they’re currently well represented at the top levels. Clearly, Latina women are also making gains in this area, while Latino men fall behind their other male counterparts.
When it comes to getting hired for mid-level tech roles, location matters, up to a point, but the results are surprising. Caucasian women got the most positive responses in Boston/Cambridge, as did Latina women, but African American women got the most positive responses in Omaha.
This contradicts many people’s expectations about hiring practices in more conservative areas. Both African American and Caucasian men got the most positive responses in Omaha, while Latino men did better in Boston/Cambridge.
Our research reveals that it’s harder than you’d think for men to get hired for mid-level tech positions. And men’s chances go down if they’re African American, and especially if they’re Latino.
How Companies Can Do Better
What can tech companies do to become more inclusive in their hiring practices? Here are some suggestions.
- Be aware of your unconscious biases about people’s names, age, gender, and ethnicity. Don’t feel bad – almost everyone has them.
- Outline the criteria that really matter when hiring, such as experience, skills, and so on. Make sure these are the ONLY criteria used when hiring by using identical questions and a scorecard for answers. And include diverse interviewers on your panel.
- Consider removing identifying information from CVs before assessing them (kind of like the way literary competitions often work). That will prevent you from following cues that lead to bias in hiring.
- When hiring, don’t just look at people who fit your existing culture; look for those who will enrich it with something new. This makes more diverse hires an asset rather than a perceived liability.
Advice When Building Your CV
Here are some tips for putting together a CV that will help you get the job, regardless of your gender or ethnicity.
- Keep your professional summary short and focused. Ensure it relates to the key qualities tech recruiters are looking for, and include anything that really makes you stand out.
- Include relevant skills and software. With many companies using applicant tracking software, this is crucial, because if you leave these keywords out, your CV might not get in front of a human being. It’s worth even including the basics.
- For the same reason, make sure you use keywords relevant to your industry. Start with the job ad itself, then branch out to related ads and resume templates to make sure your CV is optimized for search.
- Go beyond roles to outline your achievements, and the techniques and tools you used to accomplish key tasks. This will position you as a versatile employee who will be a good hire.
- Leave out the photo. Unconscious bias (discrimination without even being aware of it) is a real factor. If your face, gender, or ethnicity doesn’t fit, you could be out of the running, even if you’re totally qualified. Let’s face it; if people really want to see your face, all they have to do is look on LinkedIn.
Further Testing
While the data from this limited study revealed some interesting results, it would be interesting to expand it in the future.
For example, we could test the same hypotheses in tech capitals around the world, from Silicon Valley to Bangalore, to see if geography makes a difference in hiring practices.
Ageism impacts numerous workplaces and individuals of varying ages, both older and younger. Testing the influence of age on hireability within the tech industry could yield intriguing insights.
What would you most like to know about tech hiring practices – and your chances of getting a job – around the world? Contact the Website Planet team, and your question could be included in our next research project.

