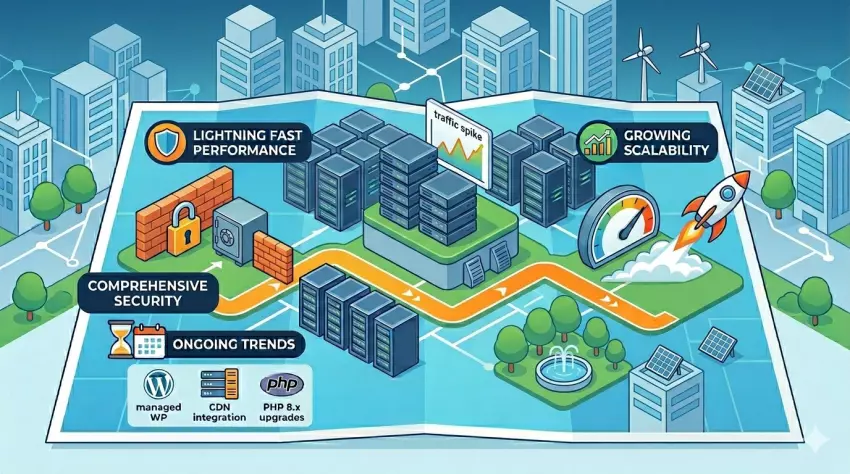
Web hosting plays a critical role in website performance, security, scalability, and overall user...
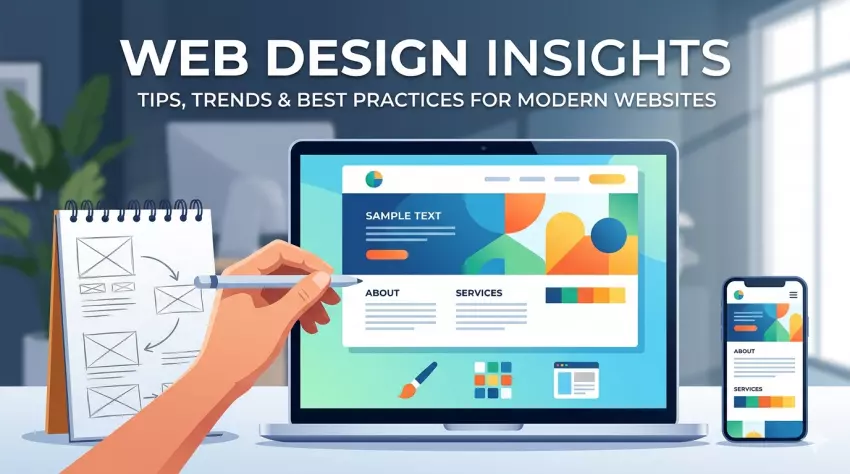
Great web design isn’t just about how a site looks—it’s about how it works, how it feels, and how...
Email marketing has evolved far beyond newsletters and promotional blasts. Today, success depends...
Social media in 2026 is no longer just about posting often or chasing the latest trend. With...
Squarespace is known for its modern templates and intuitive design tools, but it’s not without...
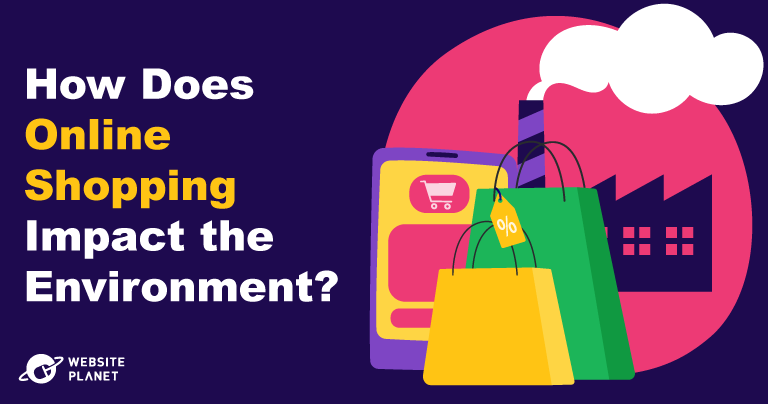
In 2024, the retail sector accounted for approximately 25% of global greenhouse gas emissions, and...
Key Takeaways Paywalls surged in the 2010s (120 new ones) but seem to have slightly stagnated...
From a single typo that erased $440 million in minutes to a software patch that bricked 8.5 million...
Running an online business means wearing a lot of hats. You might find yourself designing graphics...
Being a content creator is now one of the most popular career choices. Fueled by the rise of...